


Introduction to Trading Systems – Part II

![]() Introduction to Trading Systems – Part II – Moving Average Crossover System
Introduction to Trading Systems – Part II – Moving Average Crossover System
In this article I introduce the moving average which is by far the most popular indicator used by traders to identify trends and develop a simple and basic moving average crossover system in Excel which identifies when a crossover occurs. A moving average is a progressive average in which the divisor remains the same but at regular intervals a new data point is added to one end of the series.
Moving averages can be calculated for closing prices, highs, lows, volume or any other factor that can be measured and changes over time. A moving average can be calculated as a simple moving (SMA) average or exponential moving average, (EMA) which are by far the most popular moving averages. There are many more moving average variations which can be perused online. For the purpose of our exercise I only introduce the simple and exponential moving averages.
The SMA is calculated by computing the average price of a security/instrument over a specific number of periods. The EMA applies a smoothing to the average by applying more weight to most recent prices. The shorter the time period of the exponential moving average the more weighting is applied to the most recent prices.
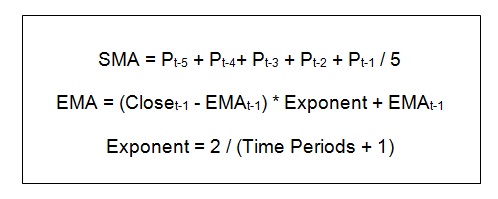
To calculate the exponent or the weighting applied to the most recent price in the EMA you simply divide the time periods plus one by 2 e.g. 2 /(10+1) = 0.1818 (18.18%) is the weighting that is applied to the most recent price in a 10 day EMA.
Calculations for the moving averages based on the close are as below:
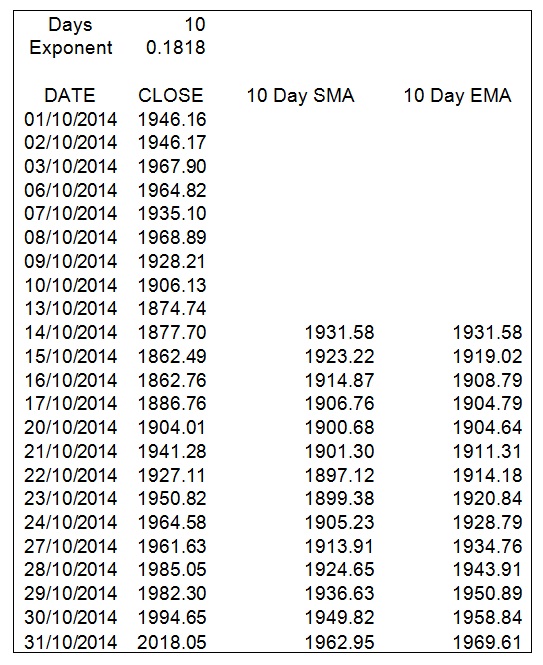
Below is an example calculation of a 10 day simple moving average and exponential moving average.
Now that we have introduced the concept of moving averages we can go on to develop an exponential moving average crossover model in Excel which can be used to generate crossover signals which can potentially be calls to buy or sell a specific instrument.
Moving average crossover models usually involve a short moving average, also called a fast moving average due to its sensitivity and fast responsiveness to price action and a long or slow moving average that lags price and acts as a low pass filter that tracks the overall longer term direction of the market.
A bullish signal occurs when the short moving average crosses over the long moving average and the bearish signal occurs when the shorter moving average crosses below the longer moving average.
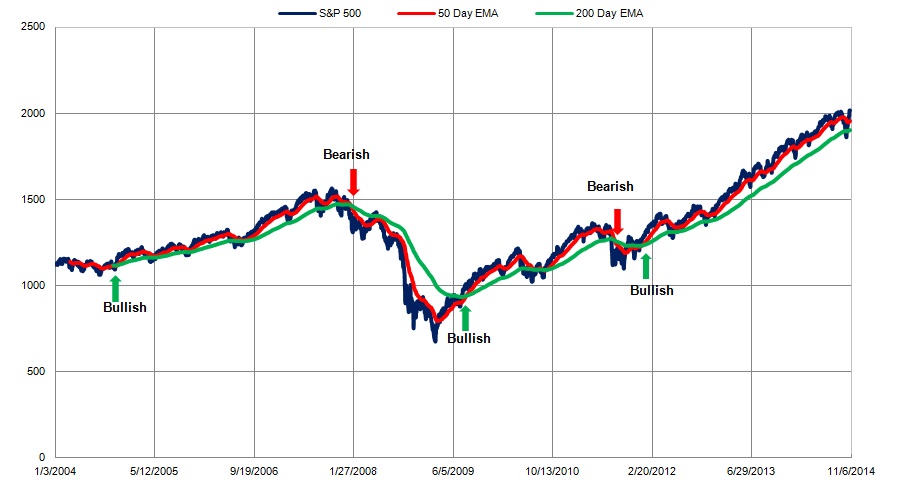
From the above chart and our Excel spread sheet we can deduce that moving average crossovers are simple yet effective tools for trend identification and for generating buy and sell signals. Of course moving averages are prone to whipsaws as is demonstrated by the bearish/bullish signals from August 2011 – January 2012. The longer the moving averages the less whipsaws one is likely to endure. This has the benefit of reducing trading frequency and all the frictional costs associated with frequent trading.
In this test I opt to keep out many variables that relate to trading tactics, position sizing and risk control in the form of a stop loss mechanism. This is mainly to isolate the effect of the moving average crossover itself without applying any other filters to the system. The scope of this article is to present a simple and effective approach and broad brush results to a likely trading system to illustrate a principle. In future papers I will introduce risk management, position sizing and money management rules that will allow us to build a complete system that seeks to answer all the questions a professional money manager or trader might ask when allocating funds to the market.
I include the Excel spread sheet for readers to experiment on and also develop their own ideas. We will be building more concepts in this file as the system development article series develops.
Part I: Introduction to Trading Systems
Find more: Contributing Authors
Related Posts
 Introduction to Trading Systems – Part I
 Jay Rajarathinam to Join TMX Group as Chief Information Officer
 When Authorities “Own” the Market, The System Breaks Down: Here’s Why
 Guess What Happened The Last Time The Price Of Oil Crashed Like This?…
 SFC commences cybersecurity review on brokers’ internet and mobile trading systems


