


Elliott Wave Analysis: Corrective Bounce In Sight; Resistance Can Be Seen Around 1.3200
 USDCAD has been trading quite aggressively lower for the last couple of weeks after a decisive break out of an upward channel connected from May of 2015 lows, which is an important evidence for a change in trend. That said, price of USDCAD is likely going even lower as decline from 1.4680 has unfolded in five waves, labeled as wave A/I; first wave of a minimum big three waves of a decline. However, nothing moves in straight lines so we need to be aware of a corrective bounce up in wave B/II which is now already underway after a bounce from 1.2450 area last week. As you know, we need three waves up first, before we may look down again, so 1.3200 resistance could be seen where new turning point may show up.
USDCAD, Daily

Click to Enlarge
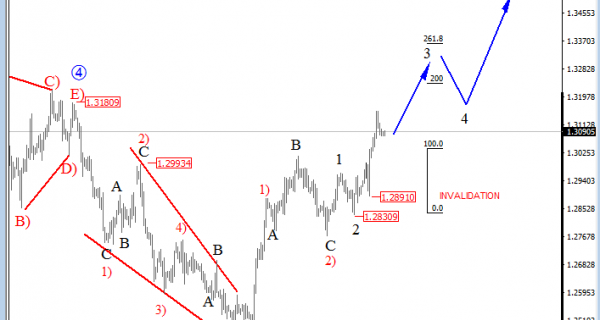
On the lower time frames, USDCAD is at a new high, now making a strong run up from 1.2890 so it can be wave three of three that will be targeting 1.3300-1.3400 area. Invalidation level is beneath 1.2963 so as long as this price is not breached we see trend in bullish mode within a big recovery that we see it unfolding on a daily chart; big three wave move up from 1.2456.
USDCAD, 4H

Click to Enlarge
http://www.ew-forecast.com/service
Find more: Contributing Authors
Related Posts
 Elliott Wave Analysis: Bigger Corrective Wave Unfolding On USDCAD; Possible Reversal Around 1.3450
 Elliott Wave Analysis: EURUSD Still In A Triangle; More Downside Still To Follow In Sub-wave D
 Elliott Wave Analysis: USDCAD Trading Within A Temporary Bullish Correction
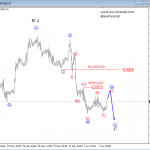 Elliott Intraday Analysis On EURUSD And GBPUSD
 Elliott Wave Analysis On EURUSD And USDCAD


