


Elliott Wave Analysis: EURUSD Still In A Triangle; More Downside Still To Follow In Sub-wave D
 EURUSD is trading lower for the last few weeks, away from 78.6% Fibonacci level after that broken channel support line connected from wave X). In fact, fall is quite sharp so we are confident that it belongs to a bigger decline; thus a three wave drop down in wave D circled that is part of a big triangle placed in wave IV.
EURUSD, Daily

Click to Enlarge
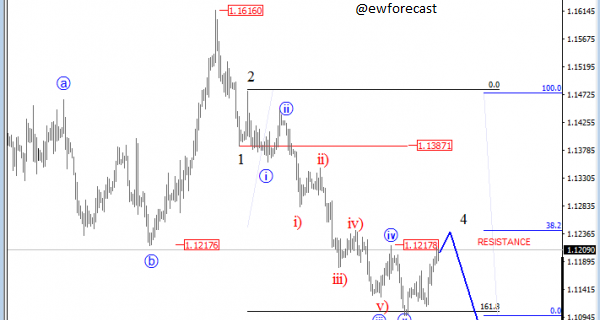
On the lower time frames, EURUSD is displaying a nice bearish price action from 1.1616 which is looking impulsive. Impulses are five wave patterns so based on recent developments and retracement up to 1.1217 we think that this is just another correction within ongoing downtrend. Ideally it’s wave 4 that is now already at resistance area so new turn down may follow in sessions ahead towards 1.1000 to complete wave A) of wave D that belongs to a big triangle pattern as shown on a daily chart.
EURUSD, 4H

Click to Enlarge
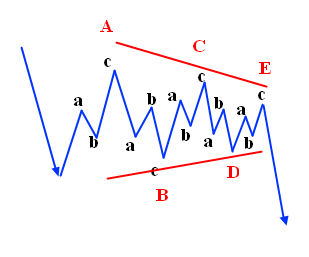
A Triangle is a common 5 wave pattern labeled A-B-C-D-E that moves counter-trend and is corrective in nature. Triangles move within two channel lines drawn from waves A to C, and from waves B to D. Triangles are overlapping five wave affairs that subdivides into 3-3-3-3-3.
A basic Triangle pattern :
http://www.ew-forecast.com/service
Find more: Contributing Authors
Related Posts
 Elliott Intraday Analysis On EURUSD And GBPUSD
 Elliott Wave Analysis On EURUSD And USDCAD
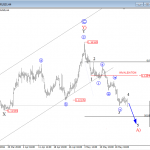 Elliott Wave Analysis: EURUSD Trading In A Triangle, Temporary Bearish Run Is In Play
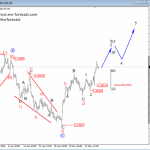 Elliott Wave Analysis: Corrective Bounce In Sight; Resistance Can Be Seen Around 1.3200
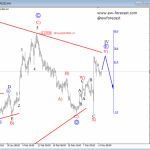 EURUSD: Complex Correction Near Completion


