Elliott Wave Analysis On EURUSD And S&P500
 EURUSD
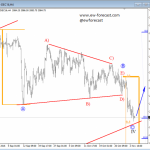
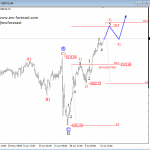
EURUSD keeps trading lower within a higher degree impulsive wave, now specifically in black sub-wave 4, that can be part of an ending diagonal, that usually shows up in the fifth and final wave. If we are right, then this unfolding ending diagonal can after its completion act as a nice reversal higher and ideally push price higher towards the former wave 4 located at the 1.0814 level. This probable reversal may take place around the 161.8 or 200 Fibonacci ratio. And another indication that suggests a probable reversal taking place is the bearish RSI divergence.
EURUSD, 1H

Click to Enlarge
S&P500
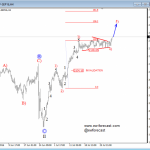
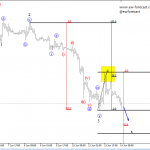
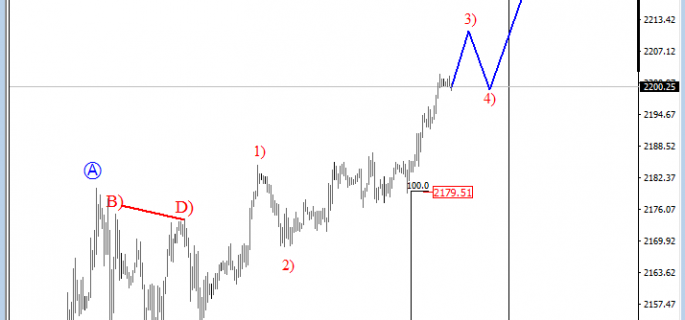
On the S&P500 we can see that price is still trading quite slow and overlapping, probably undergoing a sub-corrective wave B), that is part of a higher degree three wave fall in blue wave B. If price keeps trading as expected, then we could be in for a nice ride lower, towards the 2108/2126 zone, where final wave C within this three wave fall can finish its drop. Former wave 4 can then later act as a turning point and push price higher.
S&P500, 1H

Click to Enlarge
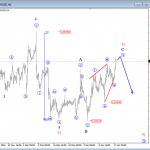
The ending diagonal is a special type of motive wave that occurs primarily in the wave 5 position when price has moved too far and too fast. Some ending diagonal triangles appear in the C wave of an ABC correction. In all cases, the ending diagonal terminates the move of larger patterns. They consist out of five waves, with each having three more sub-waves.
Basic Ending Diagonal:

http://www.ew-forecast.com/service
Find more: Contributing Authors