Elliott Wave Analysis: Higher Degree Correction on USDCAD Looks Completed; Weakness Could Already Be Here
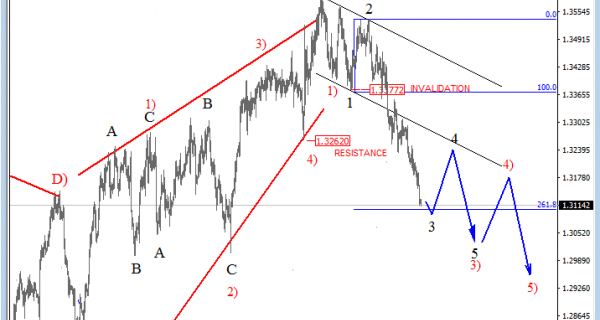
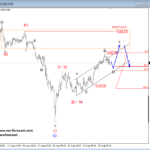
 USDCAD has made a five wave of a decline from 1.4683 high which is a very strong evidence for a bearish trend. We are talking about black wave A/I, the first wave of this big new bearish cycle, followed by slow and overlapping price movement that is either wave B or 2. So we know that eventually downtrend will resume, but the question is from where. Well, based on the previous week’s price development we can say that this probable whole higher degree correction in black wave B or 2 could be over. That said we can see that price is making a reversal from recent blue wave C highs and if price continues to go lower and beneath the lower channel line, then we could say more weakness will be in store for this pair into wave C or III and below the wave A or 1 swing at the 1.2455 level.
USDCAD, Daily
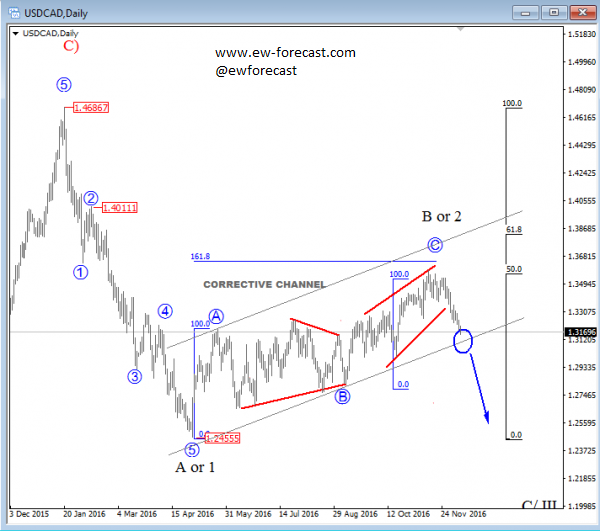
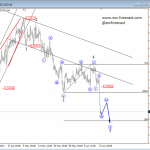
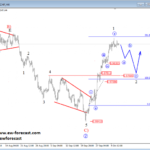
Regarding the 4h chart, USDCAD seems to be trading in a possible reversal. We see price trading now in final stages of sub-wave 3 of three, after a top had been placed at the 1.3585 labeled as the end of a higher degree wave C-circled. As such our ending diagonal is now completed and more weakness may follow in weeks to come. At the meantime, we can focus on intra-day pullbacks for a possibility to join the downtrend.
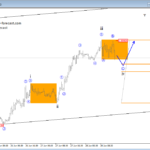
On the updated chart we can see wave 3 approaching the Fibonacci ratio of 261.8, which can cause a turning point into the following wave 4.
USDCAD, 4H
http://www.ew-forecast.com/service
Find more: Contributing Authors