


Elliott Wave Analysis: Big Triangle Correction On USDCHF Completed; More Gains May Now Follow Towards The 1.0700/1.0750
 On the Daily chart of USDCHF we are looking at a higher degree complex correction, a three wave A-B-C rise of wave IV, that seems to be in action since end of December of 2014. That said as we can see, pair recently completed a triangle correction in the connecting wave B and made a sharp reversal higher, above the sub-wave D swing. As such we now believe price may unfold a five-wave development within the final wave C of Y), before making a higher degree impulsive drop towards new lows. Ideally price will make a run towards the 1.0700/1.0750.
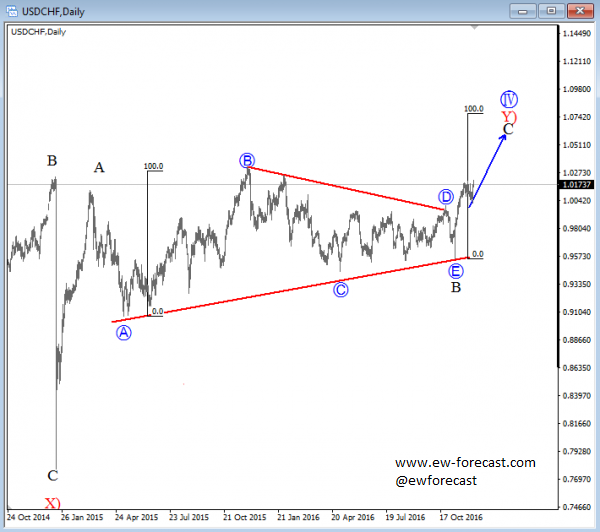
USDCHF, Daily
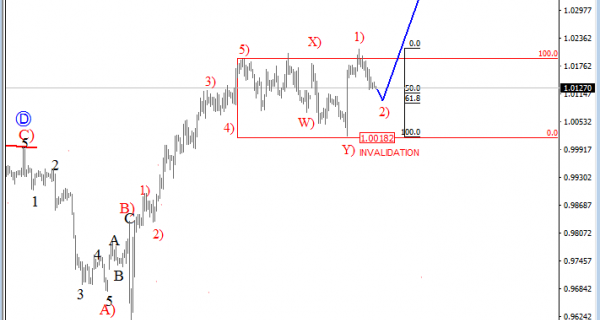
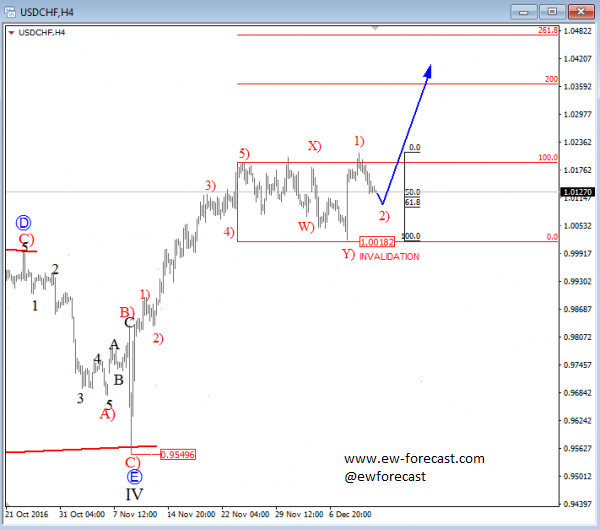
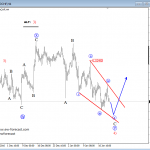
USDCHF is in a strong uptrend from 0.9550 where pair found a support following Trump’s victory. We now see sharp waves without overlaps, so we can be experiencing an impulse that belongs to a bigger bullish trend. However, as we know nothing moves in straight lines so recent slow price action visible on the 4h chart above the 1.0000 support was a corrective wave which unfolded as a double zig-zag consolidation with support kicking in at the 1.0021 level, from where a nice sharp reversal towards the extreme of sub-wave X had followed. As such this correction should now be completed and a new five wave structure may be in motion towards higher levels.
At the moment we see price trading in sub-wave 2) with a possible reversal region around the 50.0 or 61.8 Fibonacci ratio. Invalidation level is at 1.0018 level – as long it holds we are looking higher.
USDCHF, 4H
A Triangle is a common 5 wave pattern labeled A-B-C-D-E that moves counter-trend and is corrective in nature. Triangles move within two channel lines drawn from waves A to C, and from waves B to D. A Triangle is either contracting or expanding depending on whether the channel lines are converging or expanding. Triangles are overlapping five wave affairs that subdivide 3-3-3-3-3.
Basic Triangle Pattern:
http://www.ew-forecast.com/service
Find more: Contributing Authors
Related Posts
 Elliott Wave Analysis: USDCHF Looking for A Reversal Higher
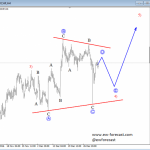 Elliott Wave Analysis: USDCHF Trading in An Impulse Of A Higher Degree; Wave 4 Is In Motion
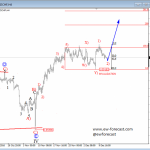 Elliott Wave Analysis: German DAX and USDCHF
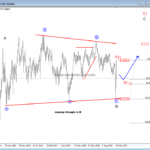 Interesting pattern on USD/CHF points higher – Elliott wave analysis
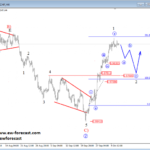 USDCAD and USDCHF Aiming Higher – Elliott wave Analysis


