


28.7% of EU GDP spent on social protection
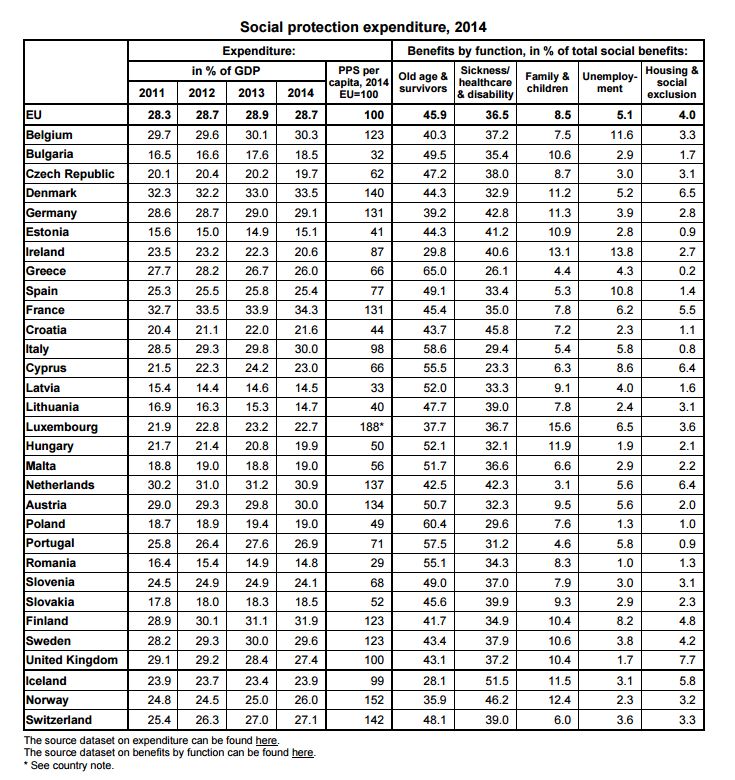
Since 2011, social protection expenditure in the European Union (EU) has increased slightly, from 28.3% of GDP in 2011 to 28.7% in 2014, according to data from Eurostat, the statistical office of the European Union. In 2014, the two main sources of funding of social protection at EU level were general government contributions from taxes, making up 40% of total receipts, and social contributions at 54%.
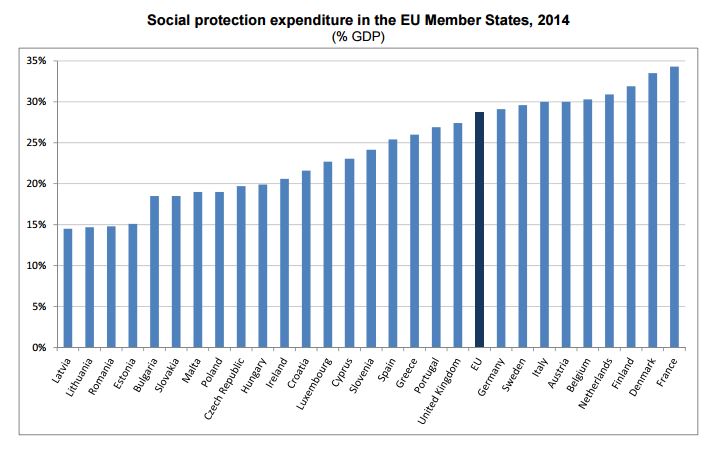
The EU average continued to mask major disparities between Member States. In 2014, social protection expenditure represented at least 30% of GDP in France (34.3%), Denmark (33.5%), Finland (31.9%), the Netherlands (30.9%), Belgium (30.3%), Austria and Italy (both 30.0%). In contrast, social protection expenditure stood below 20% of GDP in Latvia (14.5%), Lithuania (14.7%), Romania (14.8%), Estonia (15.1%), Bulgaria and Slovakia (both 18.5%), Malta and Poland (both 19.0%), the Czech Republic (19.7%) and Hungary (19.9%).
These disparities reflect differences in living standards, but are also indicative of the diversity of national social protection systems and of the demographic, economic, social and institutional structures specific to each Member State.
Social protection expenditure per capita varies substantially across Member States
In 2014, social protection expenditure per capita in PPS (Purchasing Power Standards), which eliminates price level differences between countries, showed large differences between EU Member States. After Luxembourg (see country note), the highest expenditures per capita were recorded in Denmark, the Netherlands and Austria at around 35% to 40% above the EU average, followed by Germany and France at around 30% above the average, as well as Belgium, Finland and Sweden at around 20% above. The lowest spending per capita was registered in Romania at more than 70% below the EU average, followed by Bulgaria and Latvia (between 65% and 70% below the average).
Highest share for old age and survivors benefits in Greece and Poland
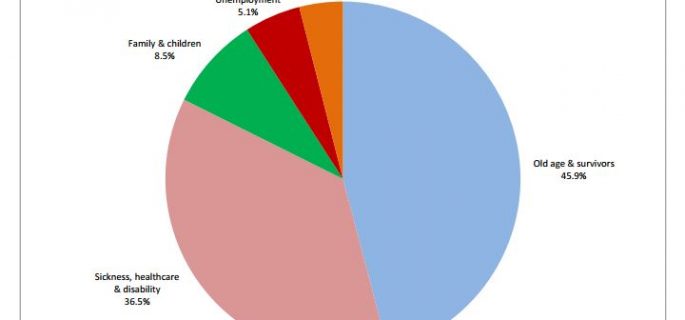
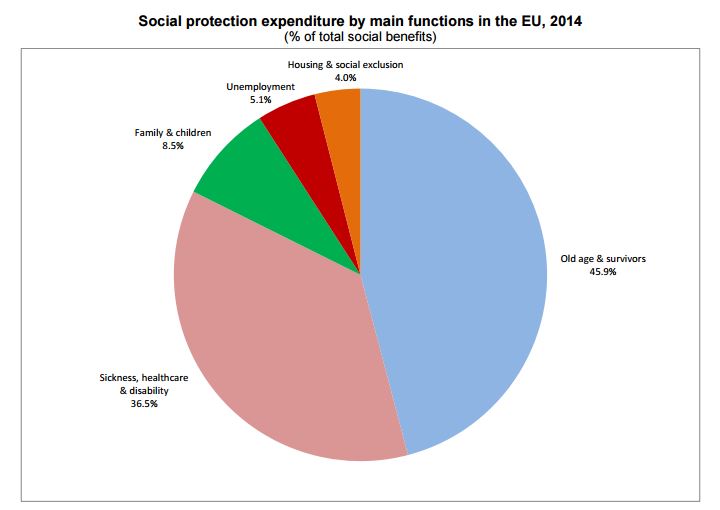
On average in the EU, old age & survivors benefits accounted for 45.9% of total social benefits in 2014, and were the major part of social protection benefits in nearly all Member States. The share of old age and survivors benefits in the total was highest in Greece (65.0%), Poland (60.4%), Italy (58.6%), Portugal (57.5%), Cyprus (55.5%) and Romania (55.1%), while it was lowest in Ireland (29.8%), Luxembourg (37.7%), Germany (39.2%) and Belgium (40.3%).
Sickness/health care and disability benefits accounted for 36.5% of total social benefits on average in the EU in 2014. They represented the largest share of social protection benefits in Ireland, Germany and Croatia. Amongst Member States, the share of these benefits ranged from 23.3% in Cyprus and 26.1% in Greece to 42.3% in the Netherlands, 42.8% in Germany and 45.8% in Croatia.
Family and children benefits accounted for 8.5% of total social benefits on average in the EU in 2014, unemployment benefits for 5.1%, and housing and social exclusion benefits for 4.0%. The share of family benefits in the total ranged from 3.1% in the Netherlands to 15.6% in Luxembourg. Unemployment benefits varied between 1.0% in Romania and 13.8% in Ireland, and housing and social exclusion benefits between 0.2% in Greece and 7.7% in the United Kingdom.
Source: Eurostat
Related Posts
 Hourly labour costs ranged from €4.9 to €42.5 across the EU Member States in 2017
 How the unemployment rate adjusted in Germany, Cyprus, Greece, Bulgaria, Romania and other member states
 House prices up by 3.4% in the euro area
 Temporary and part-time jobs on the rise in Europe
 Annual inflation up to 2.1% in the euro area


