


The hourly labour costs in EU countries; lowest in Bulgaria (€4.4) and highest in Denmark (€42.0)

Hourly labour costs ranged from €4.4 to €42.0 across the EU Member States in 2016
Lowest in Bulgaria and Romania, highest in Denmark and Belgium
In 2016, average hourly labour costs in the whole economy (excluding agriculture and public administration) were estimated to be €25.4 in the European Union (EU) and €29.8 in the euro area. However, this average masks significant gaps between EU Member States, with the lowest hourly labour costs recorded in Bulgaria (€4.4), Romania (€5.5), Lithuania (€7.3), Latvia (€7.5), Hungary (€8.3) and Poland (€8.6), and the highest in Denmark (€42.0), Belgium (€39.2), Sweden (€38.0), Luxembourg (€36.6) and France (€35.6).
In industry, labour costs per hour were €26.6 in the EU and €32.6 in the euro area, in services €25.8 and €28.7 respectively and in construction €23.3 and €26.1. In the mainly non-business economy (excluding public administration), labour costs per hour were €26.6 in the EU and €29.7 in the euro area in 2016.
Labour costs are made up of wages & salaries and non-wage costs such as employers’ social contributions. The share of non-wage costs in the whole economy was 23.9% in the EU and 26.0% in the euro area, ranging from 6.6% in Malta to 33.2% in France.
These estimates for 2016 come from an article issued by Eurostat, the statistical office of the European Union. Data cover enterprises with 10 or more employees and are based on the Labour Cost Survey data for 2012, which are extrapolated through the Labour Cost Index.

Decrease in hourly labour costs in Italy
Between 2015 and 2016, hourly labour costs in the whole economy expressed in € rose by 1.6% in the EU and by 1.4% in the euro area.
When comparing labour cost estimates over time, levels expressed in national currency should be used to eliminate the influence of exchange rate movements. Within the euro area, the largest increases were recorded in the Baltic Member States: Lithuania (+7.5%), Latvia (+6.4%) and Estonia (+5.6%). The only decrease was observed in Italy (-0.8%), while hourly labour costs remained nearly stable in Malta (+0.0%), the Netherlands (+0.1%) and Belgium (+0.2%).
For Member States outside the euro area in 2016, and expressed in national currency, the largest rises in hourly labour costs in the whole economy were registered in Romania (+12.7%) and Bulgaria (+7.8%), and the smallest increases in the United Kingdom (+1.5%) and Denmark (+1.9%).

Geographical information
The European Union (EU) includes Belgium, Bulgaria, the Czech Republic, Denmark, Germany, Estonia, Ireland, Greece, Spain, France, Croatia, Italy, Cyprus, Latvia, Lithuania, Luxembourg, Hungary, Malta, the Netherlands, Austria, Poland, Portugal, Romania, Slovenia, Slovakia, Finland, Sweden and the United Kingdom. The euro area includes Belgium, Germany, Estonia, Ireland, Greece, Spain, France, Italy, Cyprus, Latvia, Lithuania, Luxembourg, Malta, the Netherlands, Austria, Portugal, Slovenia, Slovakia and Finland.
Methods and definitions
Total Labour Costs cover wage and non-wage costs less subsidies. They do not include vocational training costs or other expenditures such as recruitment costs, spending on working clothes, etc. Wage and salary costs include direct remunerations, bonuses, and allowances paid by an employer in cash or in kind to an employee in return for work done, payments to employees saving schemes, payments for days not worked and remunerations in kind such as food, drink, fuel, company cars, etc. Non-wage costs include the employers’ social contributions plus employment taxes regarded as labour costs less subsidies intended to refund part or all of employer’s cost of direct remuneration.
The whole economy (except agriculture and public administration) includes NACE Rev. 2 sections B to N and P to S, and can be subdivided into the following economic activities:
- The business economy, which includes NACE Rev. 2 sections B to N; for the EU and euro area this accounts for about 76% of the
labour costs of the whole economy. It can be further broken down into:
– Industry, which includes: Mining and quarrying; Manufacturing; Electricity, gas, steam & air conditioning supply; and Water supply, sewerage, waste management & remediation activities. Industry accounts for around 22% of the whole economy.
– Construction, which accounts for around 6% of the whole economy.
– Services, which include: Wholesale and retail trade, repair of motor vehicles & motorcycles; Transportation & storage; Accommodation & food service activities; Information & communication; Financial & insurance activities; Real estate activities; Professional, scientific & technical activities; Administrative & support service activities. Services account for around 48% of the whole economy.
- The mainly non-business economy (except public administration), which includes NACE Rev. 2 sections P to S; for the EU and euro area this accounts for about 24% of the labour costs of the whole economy. It includes Education; Human health & social work activities; Arts, entertainment & recreation; and Other service activities.
Labour costs data presented in this News Release cover enterprises with 10 or more employees and include apprentices.
Labour cost data for the years 2004, 2008 and 2012 come from the Labour Cost Survey. Estimates for years after 2012 are obtained by extrapolating the 2012 Labour Cost Survey hourly labour cost data expressed in national currencies using the Labour Cost Index (LCI) transmitted by the Member States. In order to calculate monetary estimates in € and to derive European aggregates, exchange rate movements have to be incorporated. For this purpose, an exchange-rate adjusted LCI index is calculated for non-euro area countries. The LCI not adjusted for calendar effects is used except for Denmark, France and Sweden where only calendar-adjusted data are available.
Country notes:
France: the aggregate shown for the whole economy for 2008 also excludes NACE Rev. 2 section P (Education). Italy: data up to 2012 are not strictly comparable over time due to methodological breaks. Data for 2014 for Czech Republic, Denmark, France, Hungary and Austria are taken from national sources.
Data for 2015 for Czech Republic, Denmark, Spain, France, Hungary, Austria and Romania are taken from national sources.
Data for 2016 for France and Hungary are taken from national sources.
Source: eurostat – Labour costs in the EU
Related Posts
 Hourly labour costs ranged from €4.9 to €42.5 across the EU Member States in 2017
 Hourly labour costs ranged from €6.0 to €44.7 across the EU Member States in 2019
 House sales increase in 2021 in the majority of EU Member States
 All EU Member States’ economies set to grow in 2016, 2017 and 2018, EC forecast
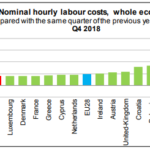 Hourly labour costs rose in the euro area; The two main components of labour costs


