Elliott Wave Analysis: GBPJPY and USDMXN

Elliott Wave Analysis: GBPJPY and USDMXN
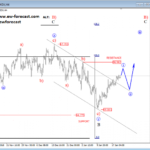
GBPJPY is making a five-wave bearish structure within blue wave c as part of a three-wave consolidation. We see current intra-day structure unfolding an overlapping movement, which can mean a potential ending diagonal within red wave v) of c can be in progress. If that is the case, then once current red wave v) fully unfolds a sharp and strong reversal to the upside can come in play.
GBPJPY, 1H

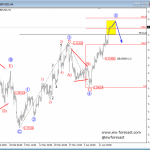
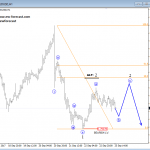
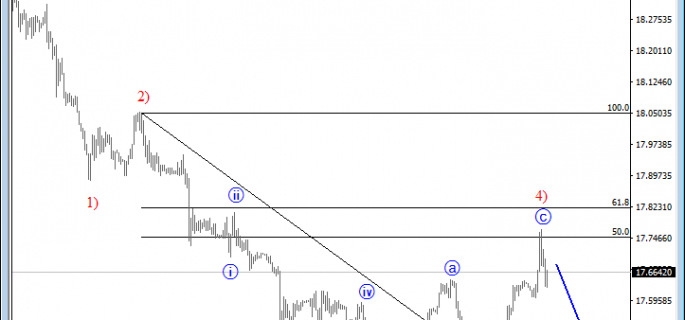
USDMXN looks to be trading in a downtrend. We see recent three wave recovery as wave 4), which ideally found resistance near the Fibonacci ratios of 50.0/61.8 and will now push prices lower into final wave 5) of this downtrend. However, if prices continue strongly to the upside from recent lows, then we can say that wave 5) had already unfolded and that more gains may unfold.
USDMXN, 1H

Disclosure: Please be informed that information we provide is NOT trading recommendation or investment advice. All of our work is for educational purposes only.
http://www.ew-forecast.com/service
Find more: Contributing Authors