ECB reports income increased for Euro area household

- Loans to households increased in the second quarter of 2016 at a higher rate of 1.7% (after 1.5% in the first quarter). Household financial investment accelerated as well (2.3% after 2.0%). Household net worth increased at a higher rate (3.2% after 2.2%).
- Non-financial corporations’ net entrepreneurial income (broadly equivalent to current profits) increased after decreasing previously (4.7% after -5.0%) as net operating surplus and net property income increased. Their financing increased at a broadly unchanged rate of 2.1%.
Households
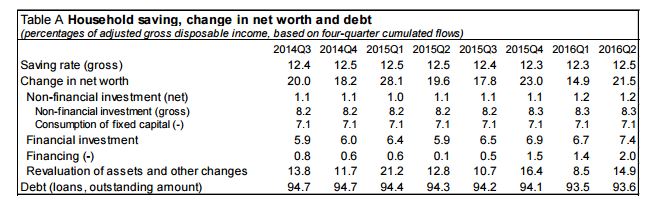
Household gross disposable income increased at a broadly unchanged annual rate of 2.6% in the second quarter of 2016. Gross operating surplus and mixed income from the self-employed increased at a higher rate (second quarter 2016: 3.5%, first quarter: 2.5%), while the compensation of employees grew at a lower rate (2.7% after 3.0%). Household consumption expenditure increased at a broadly unchanged rate of 2.2%.
The household gross saving rate in the second quarter of 2016 was 12.5%, unchanged from a year ago.
Household gross non-financial investment (which refers mainly to housing) grew at a higher rate compared with the previous quarter (6.1% after 3.1%). Loans to households, the main component of household financing increased at a higher rate (1.7% after 1.5%).
Household financial investment grew at a higher rate (2.3% after 2.0%). Among the components, currency and deposits grew at a higher rate (3.3% after 3.0%). Life insurance and pension schemes accelerated (3.1% after 2.8%), while shares and other equity decelerated (2.0% after 2.3%). While the decline of debt securities decelerated (-10.8% after -11.9%), redemptions and sales continued to exceed purchases.
Household net worth increased at a higher rate (3.2% after 2.2%), as accelerated financial and nonfinancial investments and net valuation gains on financial and non-financial assets were only partly offset by the accelerated incurrence of liabilities. The value of housing wealth increased at a higher rate (4.0% after 3.7%). The household debt-to-income ratio decreased to 93.6% in the second quarter of 2016 from 94.3% in the second quarter of 2015, as disposable income grew faster than loans to households. Table A summarises the main results for households, expressed as a percentage of adjusted disposable income (For details, see also Table 1 in the Annex).
Non-financial corporations
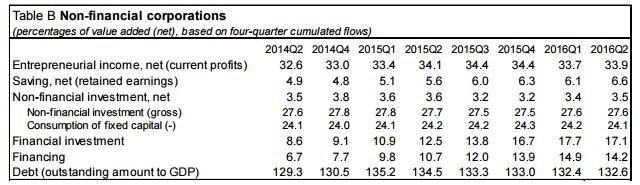
Non-financial corporations’ net entrepreneurial income (broadly equivalent to current profits) increased in the second quarter of 2016 after decreasing in the previous quarter (4.7% after -5.0%) as net operating surplus and net property income increased.
Net value added increased at a higher rate (4.3% after 3.3%). Gross non-financial investment and gross fixed capital formation accelerated as well (5.0% after 4.6%, and 5.3% after 4.7%). Financing of nonfinancial corporations grew at a broadly unchanged rate (2.1%), similar to loan financing (2.2%). Loans received from MFIs as well as loans received from non-MFIs grew at broadly unchanged rates. 1 The issuance of debt securities grew at a higher rate (5.2% after 3.4%), while trade credit financing decelerated (1.9% after 3.0%). Equity financing grew at an unchanged rate (2.1%).
The debt-to-GDP ratio decreased to 132.6% compared to 134.5% in the second quarter of 2015. Financial investment grew at a rate (3.7%) that was broadly unchanged compared to the first quarter of 2016.
Among the components, loans granted grew at a lower rate (3.4% after 3.9%) and investment in shares and other equity decelerated (3.2% after 3.4%) as well. Table B summarises the main results for non-financial corporations, expressed as a percentage of net value added (For details, see also Table 2 in the Annex).
Source: ECB