Elliott Wave Analysis On USDJPY And GOLD
 USDJPY
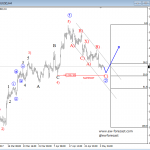
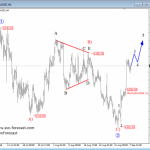
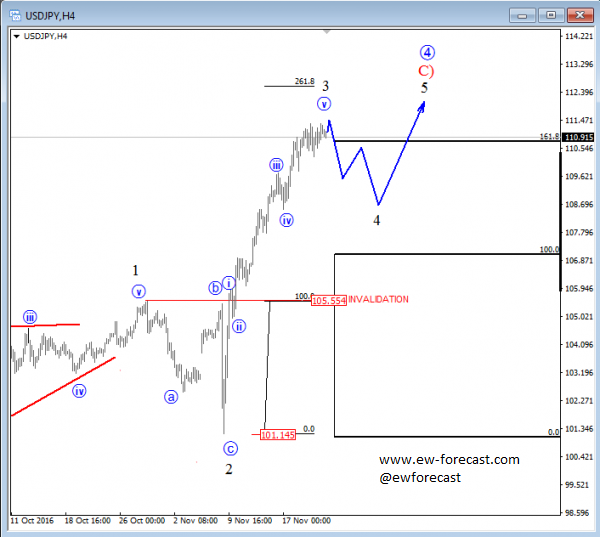
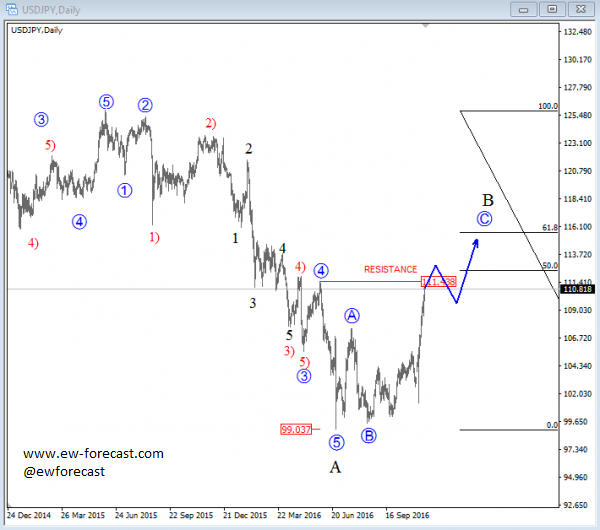
A strong rally on USDJPY last week above 106.00 suggests that market is in a bigger and more complex recovery which can be wave B of a higher degree as shown on a daily chart. If that’s the case then on the 4h chart leg up from August low is sub-wave C) that should reach much higher levels after a pullback down into a sub-wave four, which can be around the corner now since we can count five minor waves up in extended wave 3 near 161.8% Fib. resistance.
USDJPY, 4H
USDJPY, Daily
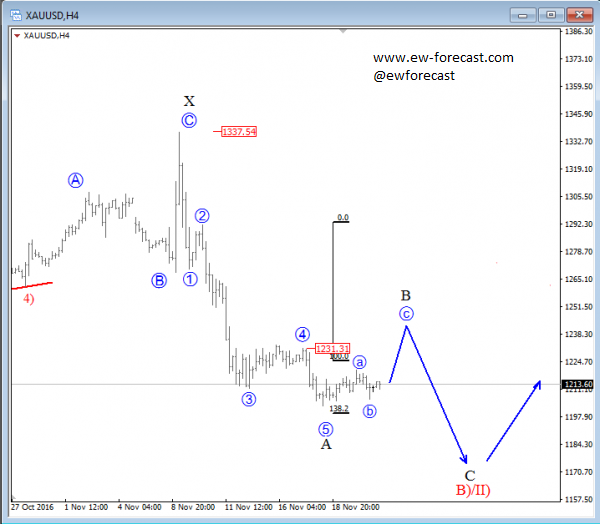
GOLD
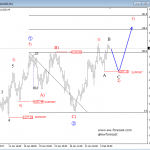
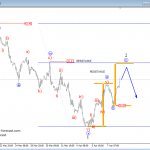
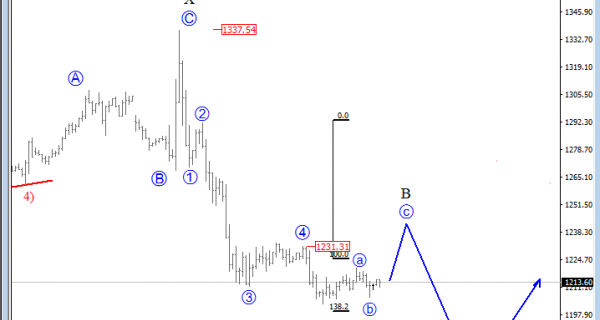
Gold is moving sharply lower, away from 1337 swing high where market found a top of wave X that belongs to a big complex decline on a daily chart. So, we are tracking a double zigzag which should see more weakness after black wave B bounce. As we see on the 4h chart, the first wave A could be finished as market unfolded five minor sub-waves within it. As such recent minor intraday activity, may be sub-wave a and unfolding wave b of B that may ideally find its resistance and a turning point lower around the 1231.3 level, where former wave 4 can act as a reversal trigger.
GOLD, 4H
http://www.ew-forecast.com/service
Find more: Contributing Authors