USDMXN and USDNOK Both Trading Bearish; But For How Long?

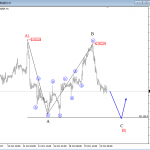
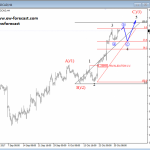
USDMXN is trading bearish, with recently completed temporary pullback in red wave 4) at 19.400 level. Current drop that is now underway can be final wave 5), that can see limited downside around the lower two Elliott wave channel lines, that can offer support and turning point zones near the 19.047/19.120 region. A later rally in five minor waves would suggest a change in trend from bearish to bullish.
USDXMN, 1h

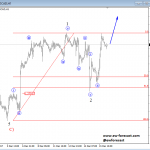
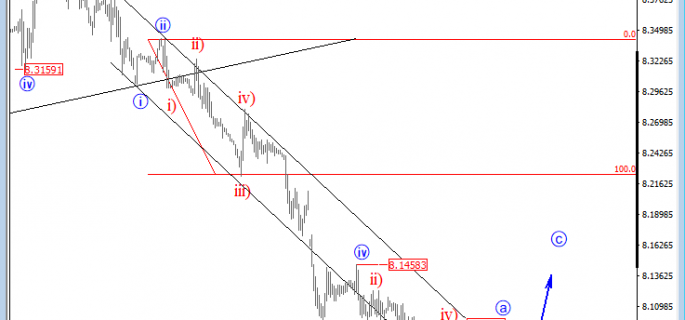
USDNOK can be trading at the end of a bigger bearish movement, that started at the 8.4184 swing high. We can see five waves unfolded, and also a nice intra-day rally, that could potentially suggest a completed fall and a temporary change in trend, from bearish to bullish. A confirmation for a minimum three-wave recovery would be a break above the 8.0946 former swing high and above the upper Elliott wave channel line.
USDNOK, 1h

Disclosure: Please be informed that information we provide is NOT trading recommendation or investment advice. All of our work is for educational purposes only.
http://www.ew-forecast.com/service
Find more: Contributing Authors