Can USDMXN Break Out Of A Triangle?
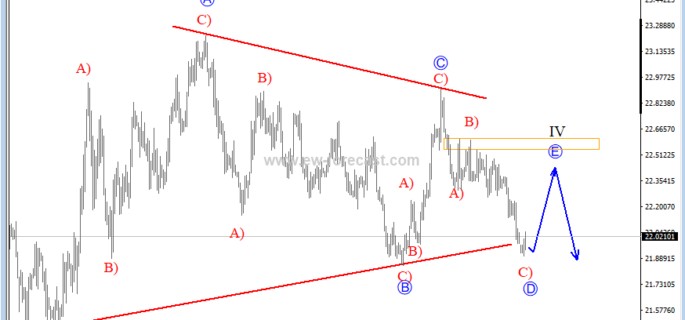

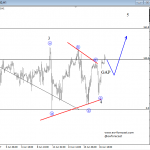
USDMXN is trading sideways since the beginning of June and it looks like it is forming a big, bearish Elliott wave triangle in wave IV that can send the price even lower for wave V, but seems like one more intraday wave up is still missing before we may see a continuation to the downside. That said, watch out for another and final wave E recovery back to 22.50 resistance area before the real bears show up.
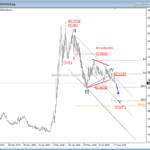
USDMXN, 4h

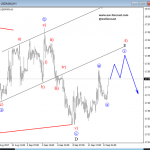
A Triangle is a common 5-wave pattern labelled A-B-C-D-E that moves countertrend and is corrective in nature. Triangles move within two channel lines drawn from waves A to E, and from waves B to D. A Triangle is either contracting or expanding depending on whether the channel lines are converging or expanding. Triangles are overlapping five wave affairs that subdivide 3-3-3-3-3.
Triangles can occur in wave 4, wave B, wave X position or in some very rare cases also in wave Y of a combination.
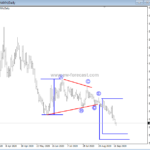
Symmetrical triangle in downtrend:

Below is a new video analysis for USDMXN, so make sure to check it out for a more detailed view.
Disclosure: Please be informed that information we provide is NOT trading recommendation or investment advice. All of our work is for educational purposes only.
http://www.ew-forecast.com/service
Find more: Contributing Author