Technical Analysis Gold – Rallies to Two Week High Above $1310

Technical Analysis for Gold for Friday, August 8, 2014
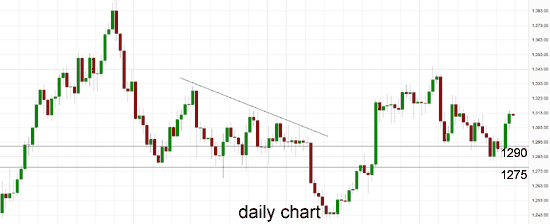
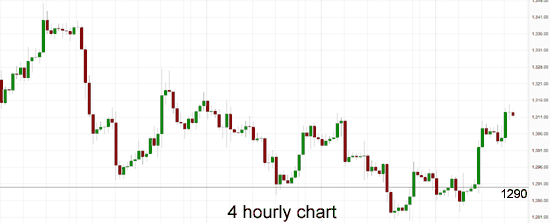
In recent hours, gold has been trading in a small trading range between $1311 and $1313 after moving up well in the last 48 hours or so. In that time it has surged higher away from the support level at $1290 and back up well above $1300 to a two week high above $1310. Over the last week or so gold had been easing lower and placing pressure on the support level at $1300 which eventually gave way resulting in gold falling sharply back down to a six week low near $1280. Over the last few weeks the $1290 level has shown some signs of support and held gold up and this level has been called upon again in the last week to prop gold up. The $1300 level has been reinforced as a level of significance in the last few weeks with gold falling sharply from its highs above $1345 back down to this level where it was initially met with overwhelming demand.
During the second half of June, gold steadily moved higher but showed numerous incidents of indecision with its multiple doji candlestick patterns on the daily chart. This happened around $1320 and $1330. The OANDA long position ratio has moved back down below 60% again as gold has settled around $1300 for a little while. At the beginning of June, gold did very well to repair some damage and return to the key $1275 level, then it has continued the momentum pushing a higher to its recent four month high. After moving so little for an extended period, gold dropped sharply back in May from above the well established support level at $1275 as it completely shattered this level falling to a four month low around $1240. It remained around support at $1240 for several days before its strong rally higher. It pushed down towards $1280 before sling shotting back and also had an excursion above $1300 for a short period before moving quickly back to the $1293 area again. Over the last few weeks gold has eased back from around $1315 to establish its recent narrow trading range below $1295 before its recent slump.
Way back since March, the $1275 level has established itself as a level of support and on several occasions has propped up the price of gold after reasonable falls. Throughout the second half of March gold fell heavily from resistance around $1400 back down to a several week low near support at $1275. Both these levels remain relevant as $1275 continues to offer support and the $1400 level is likely to play a role again should gold move up higher. Through the first couple of months of this year, gold moved very well from a longer term support level around $1200 up towards a six month higher near $1400 before returning to its present trading levels closer to $1300.
Gold managed to settle in the green on Thursday, after slumping for most of the morning, boosted by safe-haven buying amid rising tensions in Iraq and Ukraine. And analysts said the metal could gain further after having breached key technical resistance. Bullion climbed after The New York Times reported that U.S. President Barack Obama was considering air strikes and emergency relief airdrops to help 40,000 religious minorities in Iraq, who are trapped on a mountaintop after threats by Islamic militants. A White House spokesman later would not say if air strikes were being considered. Analysts said technical buying could further lift gold after worries about a possible escalation of the military conflict in Ukraine sent bullion prices above key resistance, including the 50-day and 100-day moving averages on Wednesday.
(Daily chart / 4 hourly chart below)


Gold August 8 at 00:35 GMT 1311.1 H: 1313.5 L: 1311.1
Gold Technical
During the early hours of the Asian trading session on Friday, Gold is trading in a small trading range between 1311 and 1313 after moving up well in the last 48 hours or so. Current range: trading right around $1311.
Further levels in both directions:
• Below: 1290, 1275 and 1240.
• Above: 1330.
Economic Releases
- 01:30 AU RBA Statement on Monetary Policy
- 01:30 AU Housing & Lending Finance (Jun)
- 08:30 UK Trade Balance (Jun)
- 12:30 CA Unemployment (Jul)
- 12:30 US Non Farm Productivity (Prelim.) (Q2)
- 12:30 US Unit Labour Costs (Prelim.) (Q2)
- 14:00 US Wholesale Inventories (Jun)
- JP BoJ MPC – Overnight Rate (Aug)
- JP Economy Watchers Survey (Jul)
- JP BoJ Monetary Policy Statement
*All release times are GMT
This article is for general information purposes only. It is not investment advice or a solution to buy or sell securities.
Source: marketpulse


My partner and I stumbled over here different page and thought I
might check things out. I like what I see so now i’m following
you. Look forward to looking over your web page repeatedly.