OSB Daily Technical Analysis- Indices
OSB Daily Technical Analysis for September 26, 2014
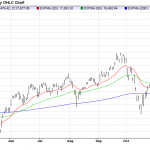
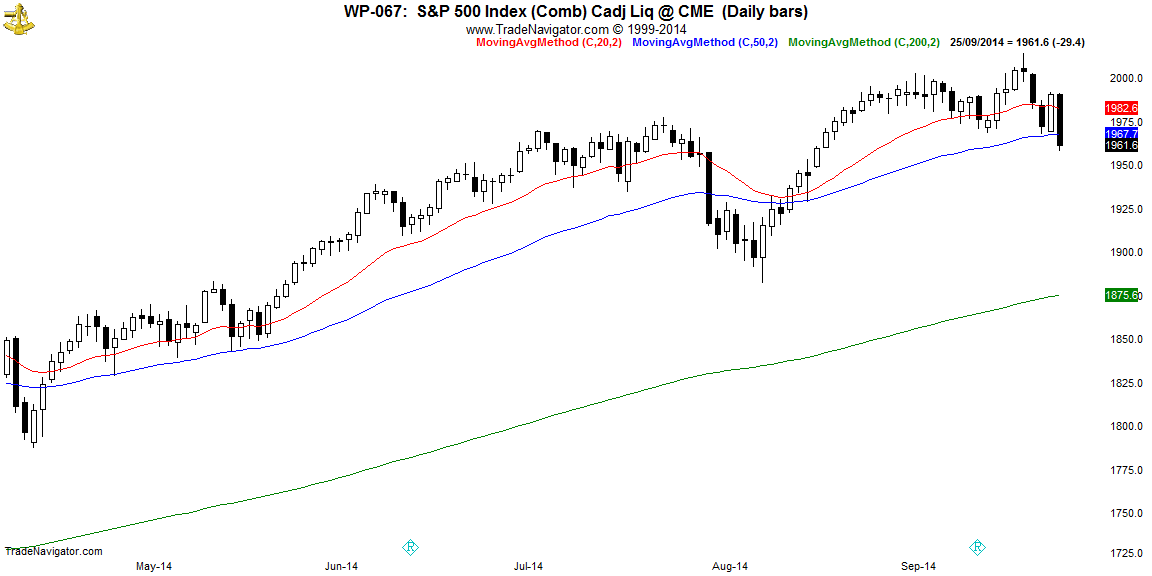
S&P 500 DEC 14 S&P sold off and sliced through the 20 and 50 DMA’s to close at 1961. Support below at 1950. Knee jerk reaction needs to be watched vigilantly. A close below support extends down to 1925.
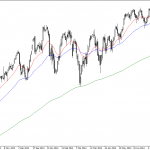
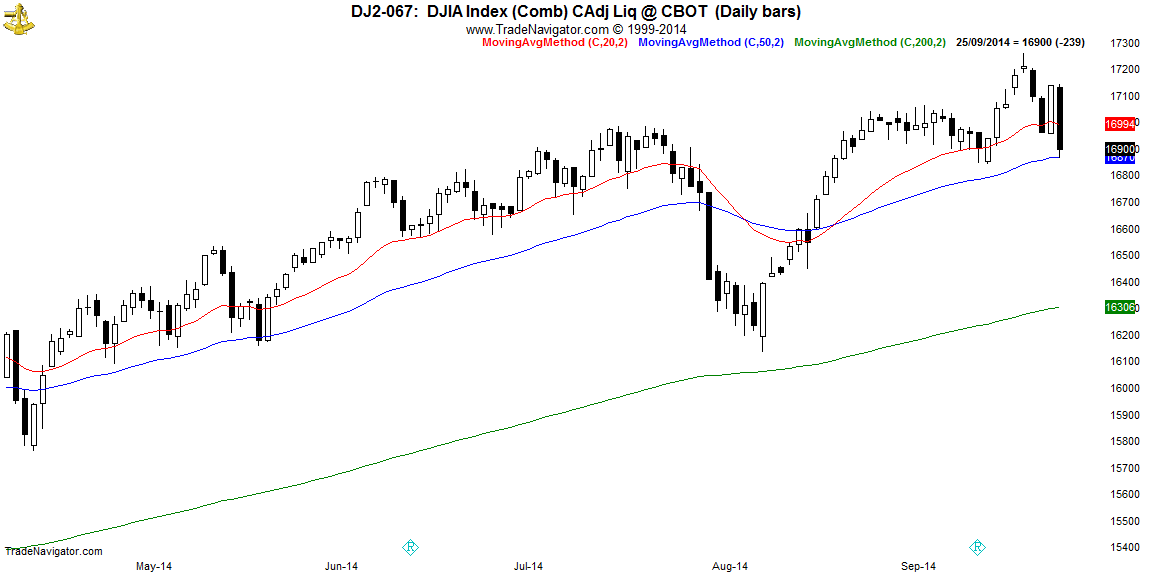
Dow 30 Break down of Dec 14 Dow found support on the 50 DMA at 16870. Sharp sell-off indicates nervousness in the market. Further support below at 16825 and 16800. Key points to watch. Bullish bias but cautious.
NASDAQ 100 NASDAQ 100 sold off and found strong support at 4000 level just above the 50 DMA. Support level likely to be retested. Further support below at 3965. Bullish.

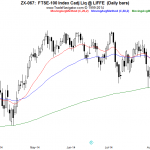
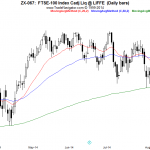
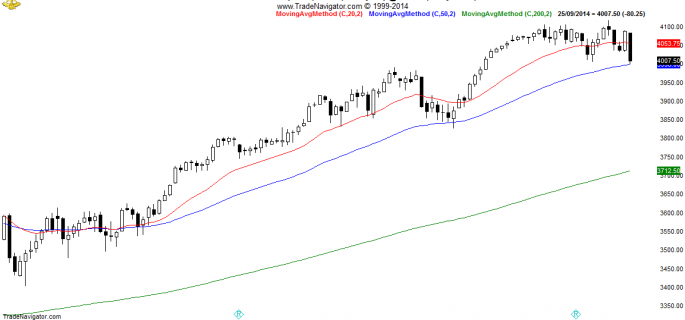
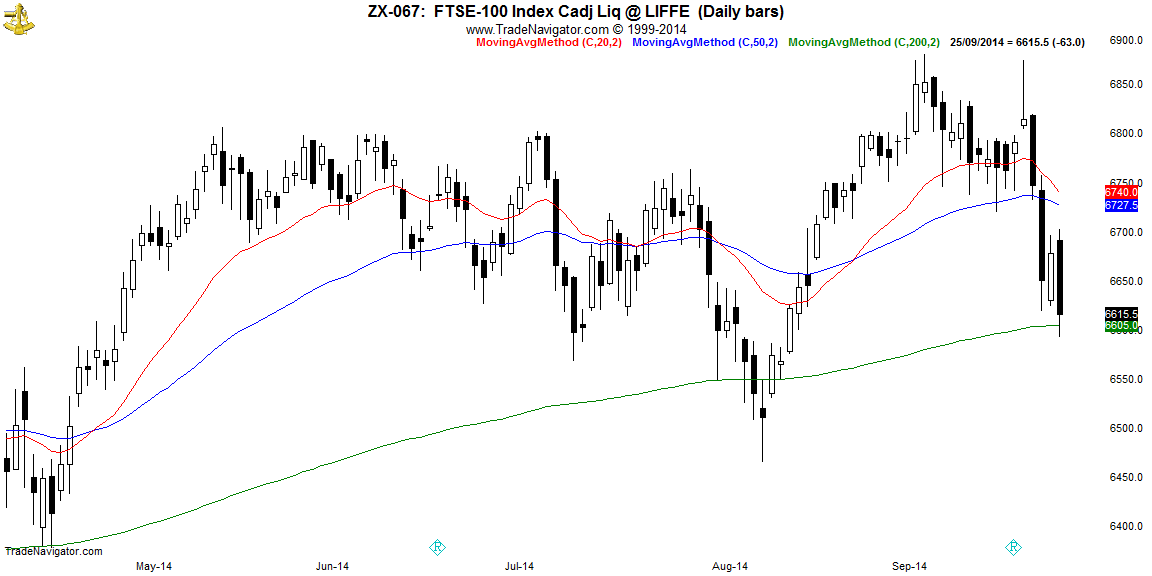
FTSE100 FTSE 100 broke below the 200 DMA intraday only to get back above and close at 6615. Starting to look bearish with selling pressure increasing. Market need to get back above 50 DMA to hold within recent range. Bearishness building up.
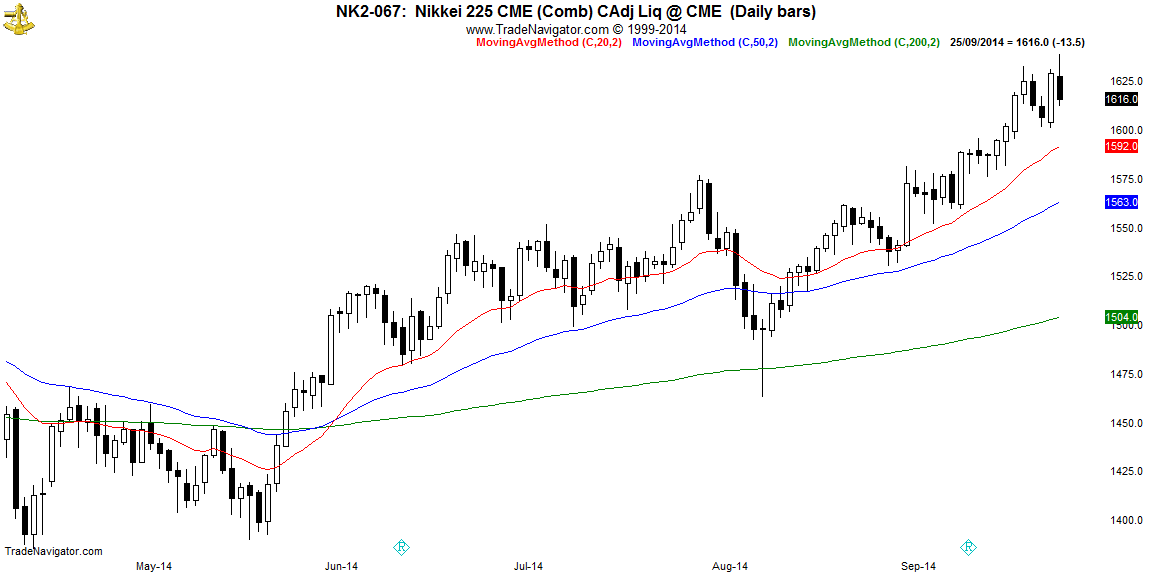
NIKKEI 225 Nikkei got close to new 52 week highs on Thursday only to reverse and close lower for the day. Support at 1600 level and resistance above at 1644.Bullish.
Risk Disclaimer
Forex and CFDs are leverage products, involved a high level of risk and can result in the loss of all your invested capital. Forex and CFDs may not be suitable for all investors. You should not risk more than you are prepared to lose. Before deciding to trade, you should ensure that you understand the risks involved and take into account your level of experience.
All information on this website, including any opinion, charts, prices, news, data, Buy/Sell signals, research and analysis is our point of view and is provided as general market commentary and does not constitute any investment advice.
OneStopBrokers.com will not accept any responsibility or liability for losses incurred by customers, visitors or traders as a result of using the data available on OneStopBrokers.com. Read more