Technical Analysis: Indices – Nov 17
Technical Analysis for November 17, 2014
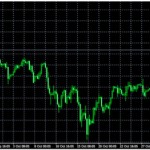
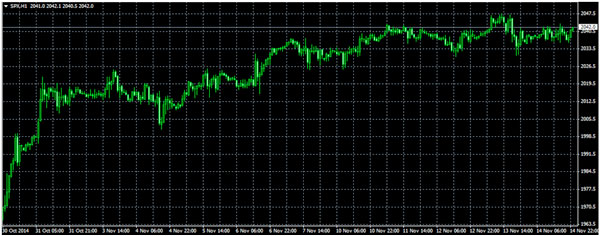
SPX has retraced some of the last bear movement in the chart and still trading around 2020-2050 level and the next support could be seen around 2015 level and A break higher than 2050 will bring the price even higher.
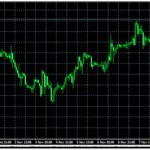
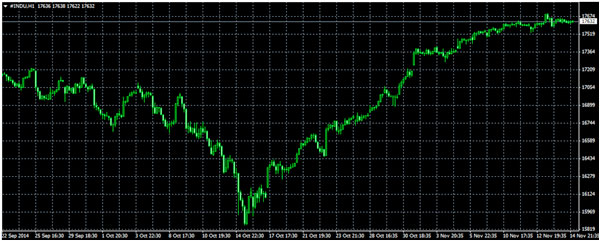
Dow30 Long term uptrend in Dow Jones still remain intact and a there are no sign for a rebounce. A break under 17300 will send the Dow Jones even lower and currently Dow Jones sticking around 17300 – 17600 level and still bullish.
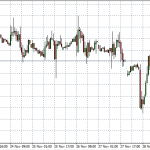
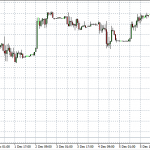
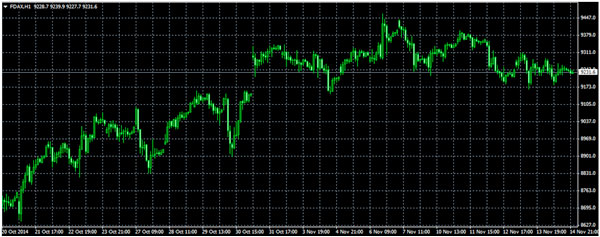
FDAX No major change in FDAX from the last Friday’s movement and FDAX has been trading around 9180-9400 level. FDAX is expected to keep trading around these levels. A lower leg under that will target 9100 next. A break over 9350 level will bring the market to the bull side once more again and send FDAX even higher.
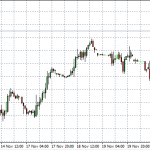
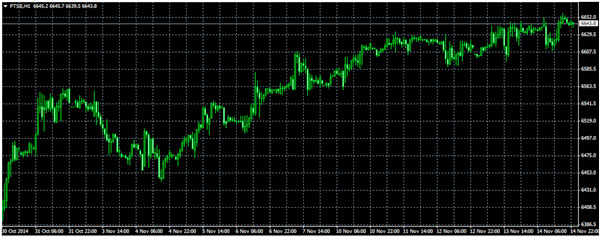
FTSE has broken 6630 level and it will target 6680 next. Resistance will be seen around 6680 level and a break over that will target 6740 next. A lower leg to 6580 will target 6540 next.
Risk Disclaimer
Forex and CFDs are leverage products, involved a high level of risk and can result in the loss of all your invested capital. Forex and CFDs may not be suitable for all investors. You should not risk more than you are prepared to lose. Before deciding to trade, you should ensure that you understand the risks involved and take into account your level of experience.
All information on this website, including any opinion, charts, prices, news, data, Buy/Sell signals, research and analysis is our point of view and is provided as general market commentary and does not constitute any investment advice.
OneStopBrokers.com will not accept any responsibility or liability for losses incurred by customers, visitors or traders as a result of using the data available on OneStopBrokers.com. Read more