More Scary Numbers
 The list of things hitting cyclical peaks gets longer every day. Besides the nominal amounts (debt, derivatives, money supply) that are now at all-time highs, some “as a share of GDP” indicators are starting to say similar, very scary things:
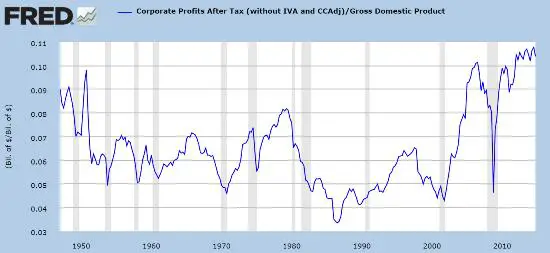
Corporate profits
In a world of competition for scarce resources, corporations face some natural limits on how much they can earn. For one thing, if business is too profitable it attracts a deluge of new entrants who drive down margins — and make stupid investments that screw things up for everyone — thus causing a broad-based recession that craters corporate profits.
And when it’s perceived that companies are taking too much (as when CEO salaries and executive stock options become obscenely generous compared to worker salaries), the other players, including government and labor, start grabbing what they see as their fair share. That’s happening now with the higher minimum wage movement and government attempts to close offshore tax loopholes, among other things.
So corporate profits tend to be cyclical, rising as a share of GDP in good times and then plunging during recessions. The chart below has this number at a new record high. In other words, every time it has been anywhere close to today’s level the result has been a nasty mean reversion.
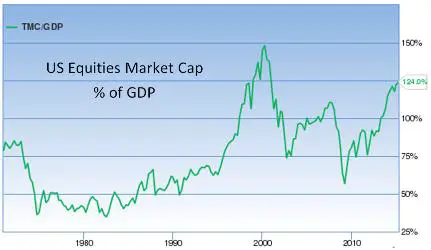
Equities market value
If corporate profits are way up it makes sense that stock prices would be too. And they are: The value of US equities as a percentage of GDP is at the second highest level ever, below only the dot-com bubble peak. Again, not the kind of number that has in the past preceded good times.
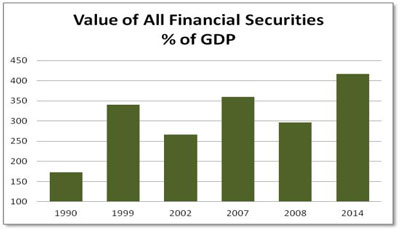
Total securities valuation
But equities are only one part of the financial securities complex. Bonds are way up lately, which should also skew the data a bit. As Doug Noland put it in a recent Credit Bubble Bulletin:
“Total Securities” as a percentage of GDP is helpful for Bubble Analysis. After beginning the nineties at 173% of GDP, “Total Securities” ended the Bubble year 1999 at an unprecedented 341%. The bursting “tech” Bubble saw this ratio decline to 267% to end 2002. Mortgage finance Bubble reflation then pumped this ratio to a record 360% by the end of 2007. The Bubble burst and “Total Securities” ended 2008 at 297%. Six years of incredible monetary inflation had Total Securities ending 2014 at a record 417% of GDP.“
Here’s a chart built from Noland’s figures showing the peaks and valleys of the past few cycles, culminating in today’s all-time high:

The consistency of these trends implies that either this time is very, very different or a cyclical peak is close at hand.
By John Rubino, http://dollarcollapse.com/
Find more: Contributing Authors