


Interactive Brokers Group Reports Brokerage Metrics for June 2015

Interactive Brokers announced Electronic Brokerage Metrics performance for June 2015 that includes Reg.-NMS Execution Statistics
Highlights for the month included:
- 600 thousand Daily Average Revenue Trades (DARTs), 21% higher than prior year and 3% lower than prior month.
- Ending client equity of $66.0 billion, 22% higher than prior year and 1% lower than prior month.
- Ending client margin loan balances of $19.0 billion, 23% higher than prior year and 2% lower than prior month.
- Ending client credit balances of $33.4 billion, 18% higher than prior year and 1% lower than prior month.
- 310 thousand client accounts, 18% higher than prior year and 1% higher than prior month.
- 447 annualized average cleared DARTs per client account.
- Average commission per cleared client order of $4.43 including exchange, clearing and regulatory fees. Key products:
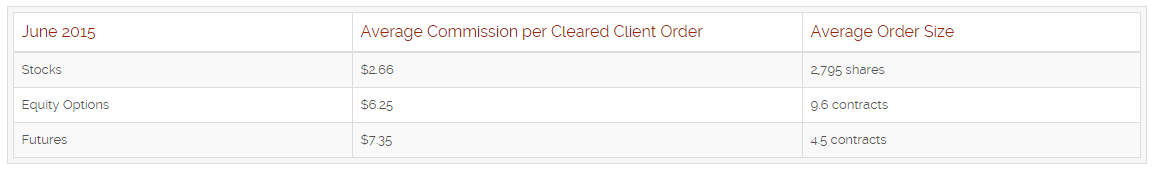
Futures include options on futures. Interactive Brokers estimates exchange, clearing and regulatory fees to be 54% of the futures commissions.
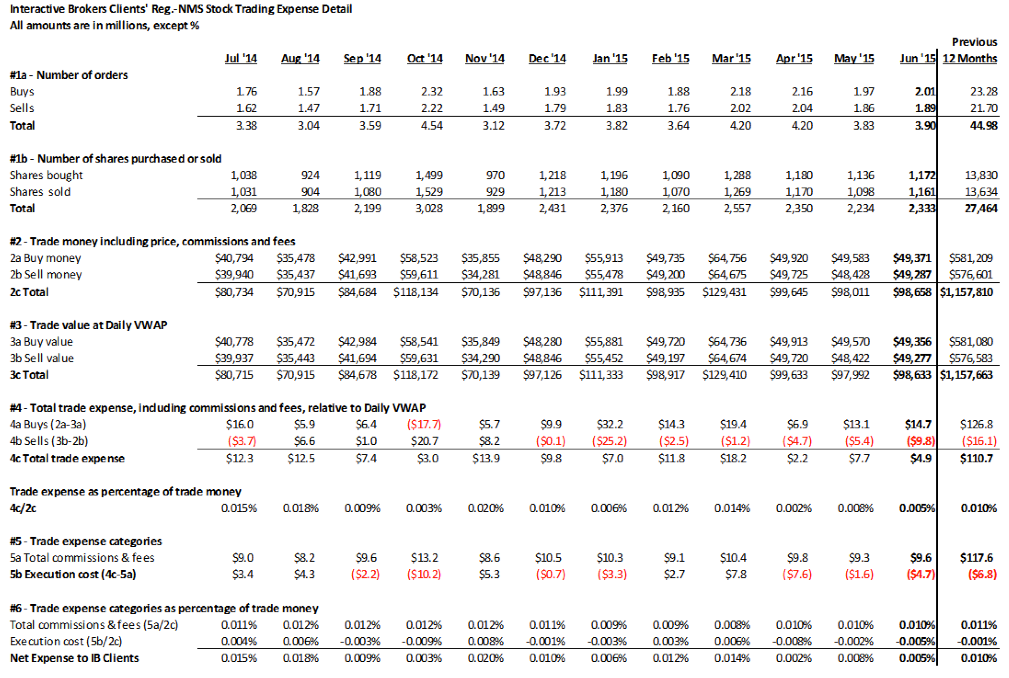
In the interest of transparency, the company quantifies their clients’ all-in cost of trade execution below.
- In June, clients’ total cost of executing and clearing U.S. Reg.-NMS stocks through IB was 0.5 basis points of trade money1, as measured against a daily VWAP2 benchmark (1.0 basis points for the rolling twelve months).
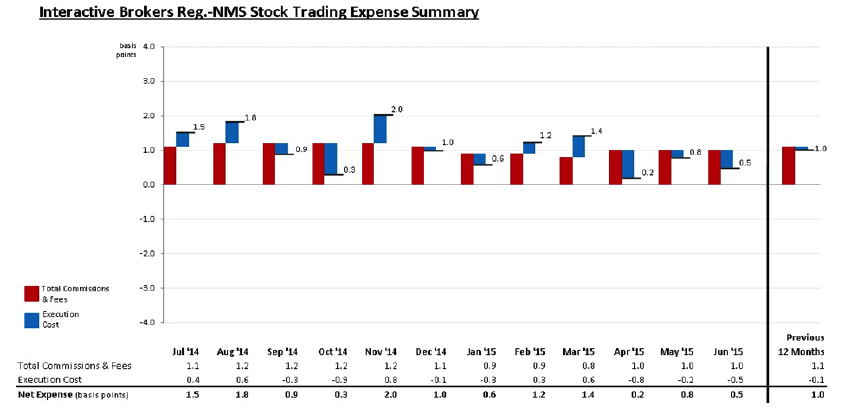
The above illustrates that the rolling twelve months’ average all-in cost of a client U.S. Reg.-NMS stock trade was 1.0 basis points.
Note 1: Trade money is the total amount of money clients spent or received, including all commissions and fees.
Note 2: Consistent with the clients’ trading activity, the computed VWAP benchmark includes extended trading hours.
Source: Interactive Brokers – Interactive Brokers Group Reports Brokerage Metrics for June 2015
Related Posts
 Interactive Brokers Group Reports Brokerage Metrics for July 2015, includes Reg.- NMS Execution Statistics
 Interactive Brokers Group Reports Brokerage Metrics for December 2015, includes Reg.-NMS Execution Statistics
- Interactive Brokers Group Reports Brokerage Metrics for April 2015
- Interactive Brokers Group Reports Brokerage Metrics for January 2016
- Interactive Brokers Group Reports Brokerage Metrics for September 2015


