


Interactive Brokers Group Reports Brokerage Metrics for December 2015, includes Reg.-NMS Execution Statistics

Interactive Brokers Group, Inc. an automated global electronic broker and market maker, today reported its Electronic Brokerage monthly performance metrics for December.
Highlights for the month included:
- 628 thousand Daily Average Revenue Trades (DARTs), 6% higher than prior year and 2% lower than prior month.
- Ending client equity of $67.4 billion, 19% higher than prior year and flat to prior month.
- Ending client margin loan balances of $17.0 billion, 1% higher than prior year and 3% higher than prior month.
- Ending client credit balances of $36.7 billion, 17% higher than prior year and 1% lower than prior month.
- 331 thousand client accounts, 18% higher than prior year and 1% higher than prior month.
- 436 annualized average cleared DARTs per client account.
- Average commission per cleared client order of $3.88 including exchange, clearing and regulatory fees. Key products:
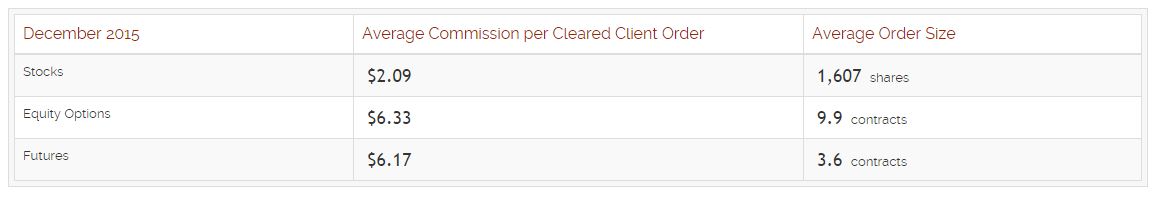
Futures include options on futures. We estimate exchange, clearing and regulatory fees to be 56% of the futures commissions.
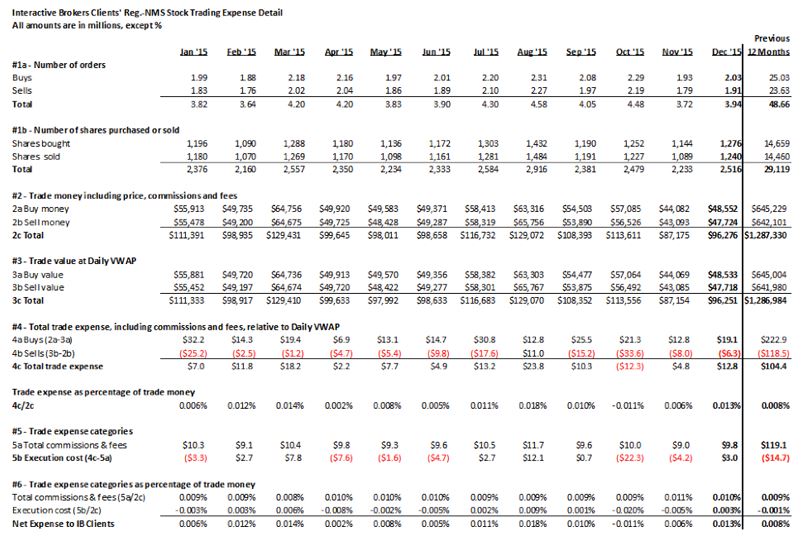
In the interest of transparency, we quantify our clients’ all-in cost of trade execution below.
- In December, clients’ total cost of executing and clearing U.S. Reg.-NMS stocks through IB was 1.3 basis points of trade money1, as measured against a daily VWAP2benchmark (0.8 basis point for the rolling twelve months).
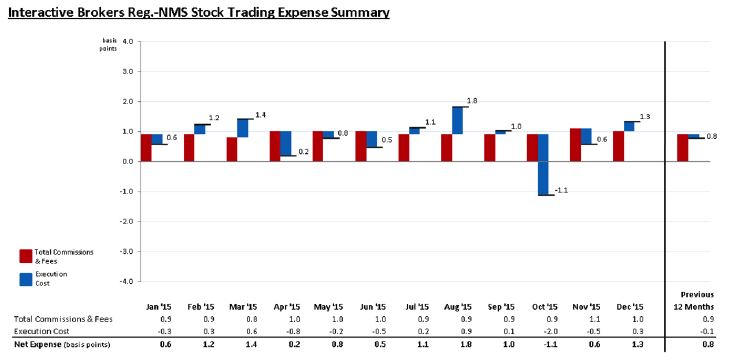
The above illustrates that the rolling twelve months’ average all-in cost of a client U.S. Reg.-NMS stock trade was 0.8 basis point.
Note 1: Trade money is the total amount of money clients spent or received, including all commissions and fees.
Note 2: Consistent with the clients’ trading activity, the computed VWAP benchmark includes extended trading hours.
Source: Interactive Brokers
Related Posts
 Interactive Brokers Group Reports Brokerage Metrics for April 2015
 Interactive Brokers Group Announces 2015 Results
- Interactive Brokers Group Reports Brokerage Metrics for May 2015
- Interactive Brokers Group Reports Brokerage Metrics for July 2015, includes Reg.- NMS Execution Statistics
- Interactive Brokers Group Reports Brokerage Metrics for June 2015


