Elliott Wave Analysis On USDJPY And USD Index
 USDJPY
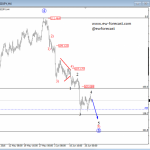
USDJPY is turning nicely to the upside for the last two weeks which now looks like a new impulsive wave in action. On the 4h chart we see current price trading higher within wave five of 1 that is also approaching that 261.8% Fibonacci target and to the upper red trendline of an expanding diagonal that can turn into a resistance. As such, a new corrective set-back could show up in days ahead; ideally with a three wave retracement back to 108.70 area. But most important of all is that market has five waves up from the low, thus trend has changed from bearish to bullish mode that is expected to continue to much higher levels based on higher time frames.
USDJPY, 4H

Click to Enlarge
USD Index
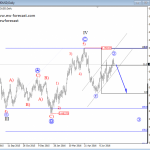
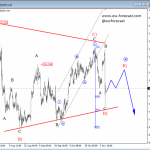
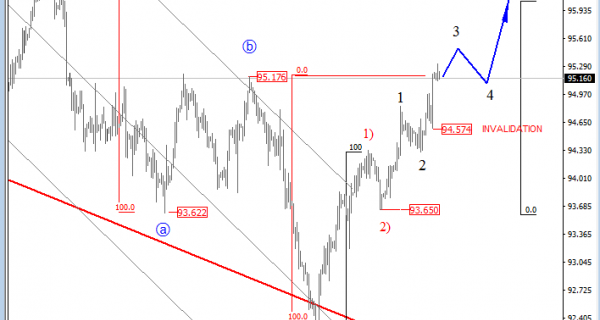
USD Index is on the sharp rise and has reached our minimum upward projections near 95.17 resistance, but bullish momentum is strong from the last 24 hours so there is still room for more strength ahead. An updated count shows idea of an extended wave 3) which means that continuation towards 96 and 96.50 should be considered while market trades above 94.57 swing low. Keep in mind that USD index might have started a new big uptrend continuation after 12 months of a downward correction shown on daily chart, so be aware of stronger buck across the board.
USD Index, 4H

Click to Enlarge
http://www.ew-forecast.com/service
Find more: Contributing Authors