


Interactive Brokers Group Reports Brokerage Metrics for May 2016

Interactive Brokers Group, Inc. (NASDAQ GS: IBKR) an automated global electronic broker and market maker, today reported its Electronic Brokerage monthly performance metrics for May.
Highlights for the month included:
- 641 thousand Daily Average Revenue Trades (DARTs), 4% higher than prior year and 3% lower than prior month.
- Ending client equity of $72.5 billion, 9% higher than prior year and 1% higher than prior month.
- Ending client margin loan balances of $15.1 billion, 22% lower than prior year and 3% lower than prior month.
- Ending client credit balances of $39.0 billion, 15% higher than prior year and 1% higher than prior month.
- 353 thousand client accounts, 15% higher than prior year and 1% higher than prior month.
- 424 annualized average cleared DARTs per client account.
- Average commission per cleared client order of $3.81 including exchange, clearing and regulatory fees. Key products:
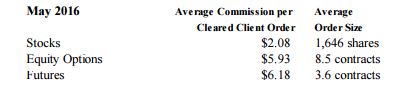
Futures include options on futures. Interactive Brokers estimate exchange, clearing and regulatory fees to be 57% of the futures commissions.
In the interest of transparency, we quantify our clients’ all-in cost of trade execution below.
- In May, clients’ total cost of executing and clearing U.S. Reg.-NMS stocks through IB was 0.3 basis points of trade money1 , as measured against a daily VWAP2 benchmark (0.6 basis point for the rolling twelve months).
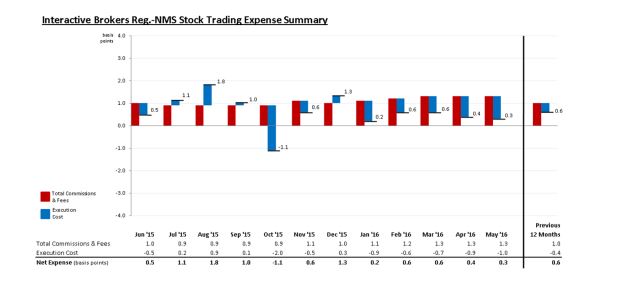
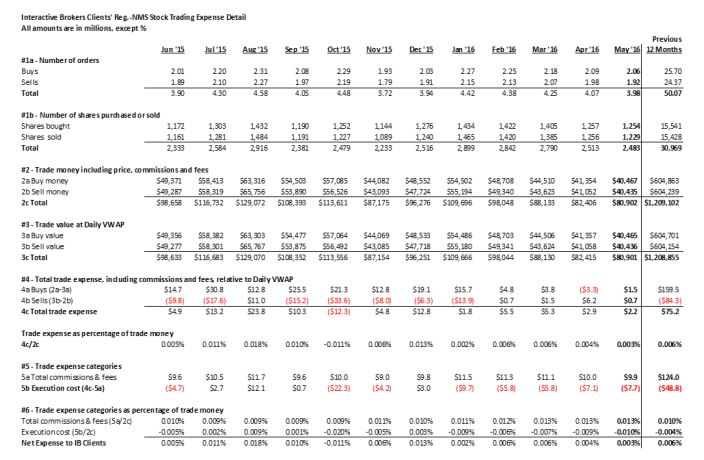
The above illustrates that the rolling twelve months’ average all-in cost of a client U.S. Reg.-NMS stock trade was 0.6 basis point.
Source: Interactive Brokers
Related Posts
 Interactive Brokers Group Reports Brokerage Metrics for February 2016
- Interactive Brokers Group Reports Brokerage Metrics for September 2015
- Interactive Brokers Group Reports Brokerage Metrics for April 2015
- Interactive Brokers Group Reports Brokerage Metrics for August 2016
- Interactive Brokers Group Reports Brokerage Metrics for March 2016


