


Elliott Wave Analysis: USDCAD In A Temporary Bullish Rally
 Elliott Wave Analysis: USDCAD In A Temporary Bullish Rally
USDCAD has made a five wave of a decline from 1.4683 high which is a very strong evidence for a bearish trend. We are talking about black wave A/I, the first wave of this big new bearish cycle, followed by current slow and overlapping price movement that is either wave B or II. So we know that sooner or later downtrend will resume, but the question is from where. Well, based on recent developments we see pair trading in the middle of a correction, with blue subwave B maybe completed, so another leg up to around 1.3400 -1.3500 area can be in the cards, where we would expect big bearish turning point to happen.
USDCAD, Daily

Click to Enlarge
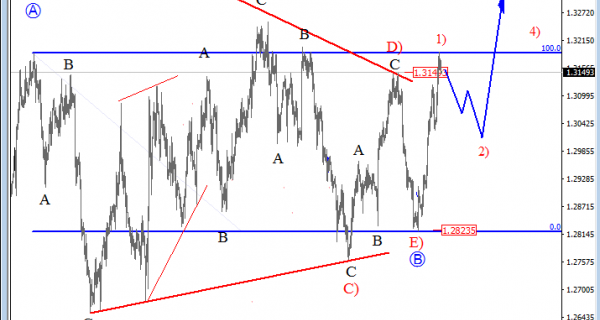
On the lower time frame, USDCAD fell down into wave E) at the start of the month, towards 1.2820 area where support was found; at the lower side of a range. Notice that reaction higher was very strong and powerful back above 1.3000, that is why we see it as an impulse. It could be the first wave within a new unfolding impulsive wave C-circled that can be now finally in play for 1.3400 area as big blue wave B triangle can be finished. That said nothing moves in straight lines so be aware of minor temporary corrections that may unfold, first being red wave 2) within blue wave C.
USDCAD, 4H

Click to Enlarge
http://www.ew-forecast.com/service
Find more: Contributing Authors
Related Posts
 USDCAD and AUDUSD Can Face A Reversal – Elliott wave Analysis
 Elliott Wave Analysis: GBPUSD and USDCAD Both Breaking Lower
 Elliott Wave Analysis: USDCAD Trading Within A Temporary Bullish Correction
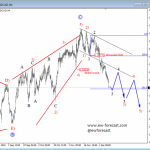 Elliott Wave Analysis: Higher Degree Correction on USDCAD Looks Completed; Weakness Could Already Be Here
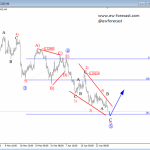 Elliott Wave Analysis: USDCAD Looking For A Base; Ending Diagonal Suggest A Change In Trend


