


Elliott Wave Analysis: USDCAD Trading Within A Temporary Bullish Correction
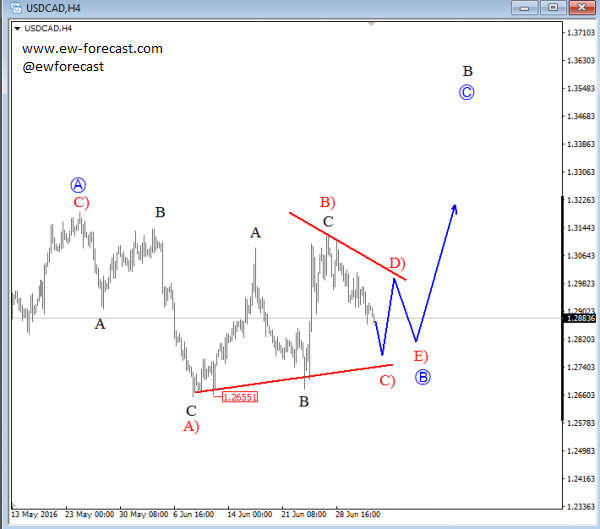
 USDCAD has been trading quite aggressively lower few months back after a decisive break out of an upward channel connected from May of 2015 lows, which was an important evidence for a change in trend. That said, price of USDCAD is likely going even lower as decline from 1.4680 has unfolded in five waves, labeled as wave A/I; first wave of a minimum big three waves of a decline. However, nothing moves in straight lines so we need to be aware of a corrective bounce up in wave B/II which is now already underway with still some room left towards 1.3700 area since we expect a bigger corrective three wave recovery.
USDCAD, Daily

Click to Enlarge
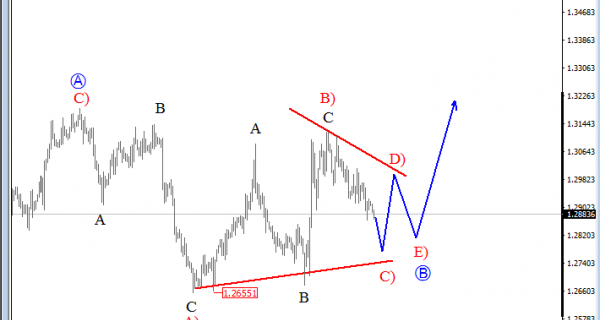
On the lower time frames, USDCAD is trading quite slow and overlapping, thus giving an impression of an undergoing triangle correction that could be in play now in blue wave B-circled. Waves A) and B) are already visible, so we are now waiting for wave C) to show up, before price makes a little bounce into red wave D). This correction is time consuming, so we would not be surprised if price starts to continue higher at the end of the week.
If price breaks beneath 1.2656 zone, we would adjust the count.
USDCAD, 4H
http://www.ew-forecast.com/service
Find more: Contributing Authors
Related Posts
 Elliott Wave Analysis: USDCAD Looking For A Base; Ending Diagonal Suggest A Change In Trend
 Elliott Wave Analysis: Corrective Bounce In Sight; Resistance Can Be Seen Around 1.3200
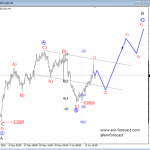 Elliott Wave Analysis: Bigger Corrective Wave Unfolding On USDCAD; Possible Reversal Around 1.3450
 Elliott Wave Analysis On EURUSD And USDCAD
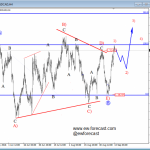 Elliott Wave Analysis: USDCAD In A Temporary Bullish Rally


