Elliott Wave Analysis: Triangle Point Lower On The AUDUSD
 Elliott Wave Analysis: Triangle Point Lower On The AUDUSD
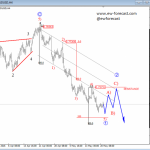
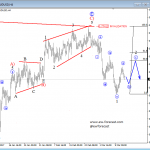
On the daily chart of AUDUSD we are observing big consolidation pattern in fourth wave which is definitely not a simple one. It’s a very complex structure that is underway for around 12 months now so we can expect a very strong breakdown once the pattern is finished. Latest substructures suggest that wave IV can be a triangle, and reason for such view is a new swing high at 0.7770 area that we labeled it as wave C-circled. So we actually have two contracting trendlines connected with swing lows and swing highs, between which wave D is now unfolding while we will have to wait on wave E for a couple more more weeks. So for now pair remains trapped in range but break to the downside is expected to occur by the end of the year.
AUDUSD, Daily

Click to Enlarge
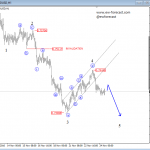
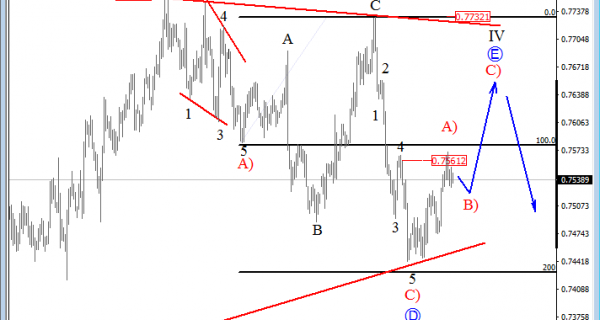
As expected AUDUSD made a nice rally towards back above 0.7530 level after a nice higher degree three wave movement had unfolded in blue wave D-circled as part of a big triangle pattern. As such break above the previous wave 4 swing at 0.7561 could now confirm that market is in wave E-circled, final wave in the pattern that may look for a resistance this week around 0.7660.
AUDUSD, 4H

Click to Enlarge
http://www.ew-forecast.com/service
Find more: Contributing Authors