Elliott Wave Analysis: GBPUSD Trading In A Higher Degree Correction
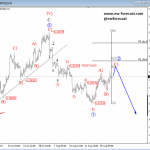
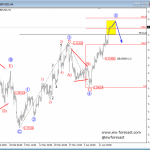
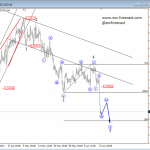
 GBPUSD fell sharply to the downside, a few weeks back which we see it as the final wave V of III) that touched the 1.1493 level. If we are correct and price really did post wave III) lows, then current upward action may be a temporary bullish rally in wave IV) with sub-wave A and now B already completed. The ideal support for wave B as we can see was at the 61.8 Fibonacci zone, from where a nice bounce higher occurred a month ago. As such final wave C is now in motion with a potential reversal zone near the 1.3464 level and the 38.2 Fibonacci ratio. That said current slow movement may only be a temporary correction.
GBPUSD, Daily

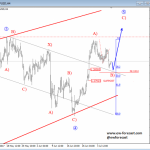
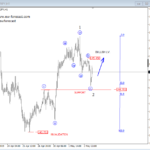
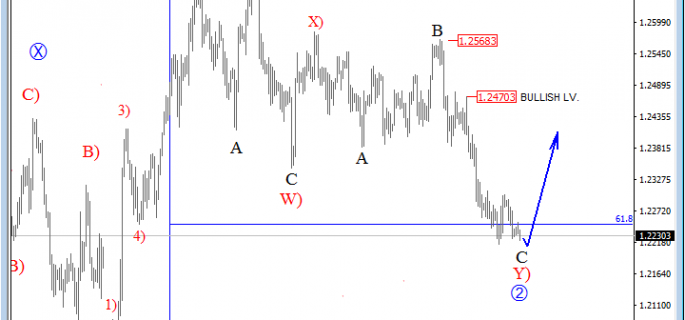
Regarding the 4h chart, we see that GBPUSD made five waves up from January low which we see it as an impulsive wave up in wave 1, followed by a recent corrective move that seems to be a complex one. We are tracking a W)-X)-Y) combination which is not over yet, but is trading near the support of 61.8% Fib level. For now, it’s too soon to call end of a corrective set-back, but rise back to 1.2470 would be strong evidence that pullback is over and that bulls are back in control.
GBPUSD, 4H

http://www.ew-forecast.com/service
Find more: Contributing Authors