Elliott wave Analysis: Bulls on EURUSD Can Be Looking For A Top
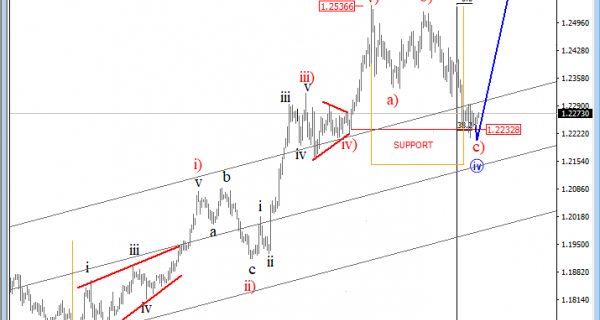

On the daily chart of EURUSD, we can see price rising for the last year or so, and this rising price action as we can see can be counted in five waves. This five-wave pattern, which we labeled as wave C) is known as a motive wave and must contain five waves. That said, once five waves within wave C) are fully visible, that’s when a new top can be formed, and a bearish reversal can follow.
EURUSD, Daily

Regarding the 4h chart, EURUSD is now trading at some important and interesting support zones, where corrective wave iv can meet its end. We see a three-wave decline at 1.2233 level, of a former swing low, and Fibonacci ratio of 38.2, where both can react as supports and reversal zones. That said, a five-wave rally would suggest a completed wave iv correction, and wave v to be in progress.
EURUSD, 4h

Disclosure: Please be informed that information we provide is NOT trading recommendation or investment advice. All of our work is for educational purposes only.
http://www.ew-forecast.com/service
Find more: Contributing Authors