Elliott wave Analysis: Triangle on USDMXN Points Higher, while AUDUSD Turned into a Temporary Correction

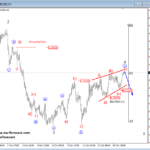
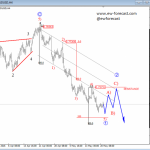
USDMXN is trapped in a consolidation for the last 4 weeks that looks like a triangle in fourth wave. It’s an A-B-C-D-E path with sub-wave E around the corner, so ideally real break higher will be seen next week.
USDMXN, 4h

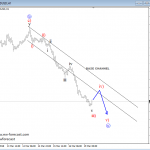
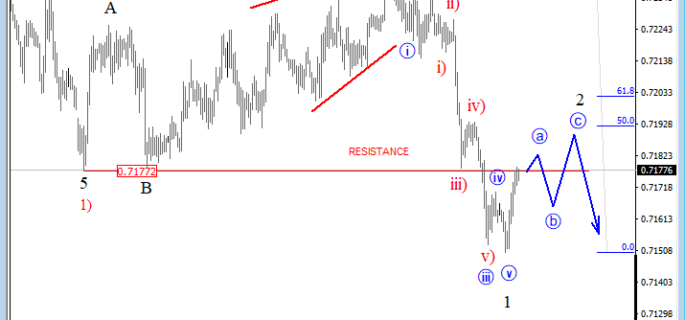
AUDUSD made a perfect five-wave drop from the 0.725 level, which is an example of an impulsive structure.
An impulse is the most common motive wave and is structure by five sub-waves in the direction of the stronger trend. That said, we also know that after every five waves a new temporary three-wave pullback may occur. In our case we can already see price picking up from the lows near 0.715, which is a suggestion of a low in place and that a temporary a-b-c pullback is in play. That said, this a-b-c structure can look for resistance and a new bearish reversal near the Fibonacci ratio of 50.0 or 61.8, from where more weakness may occur. Also, the former swing low at 0.7177 can react as good resistance for the pair.
AUDUSD, 30 Min

Disclosure: Please be informed that information we provide is NOT trading recommendation or investment advice. All of our work is for educational purposes only.
http://www.ew-forecast.com/service
Find more: Contributing Authors