Business investment rate up to 23.3% in the euro area

Eurostat, the statistical office of the European Union, has published a report in relation to the business investment rate in the euro area for the third quarter of 2018.
In accordance the report:
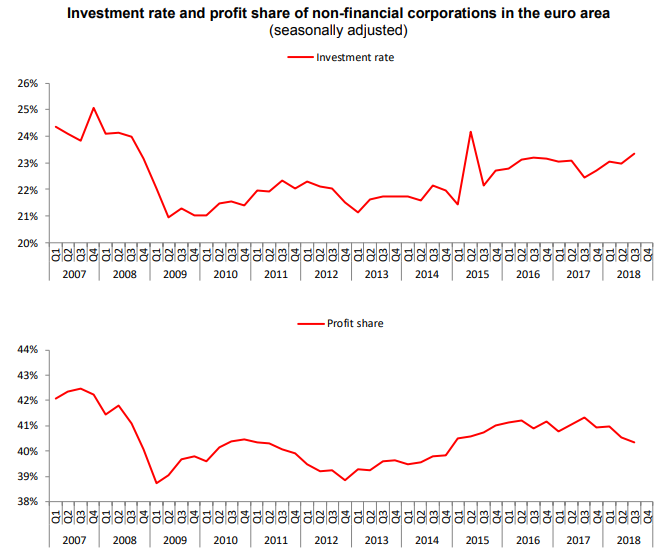
In the third quarter of 2018, the business investment rate was 23.3% in the euro area, compared with 23.0% in the previous quarter.
The business profit share in the euro area was 40.3% in the third quarter of 2018, compared with 40.6% in the second quarter of 2018.
These data come from a first release of seasonally adjusted quarterly European sector accounts from Eurostat, the statistical office of the European Union, and the European Central Bank (ECB).
Geographical information
The euro area (EA19) consists of 19 Member States: Belgium, Germany, Estonia, Ireland, Greece, Spain, France, Italy,m Cyprus, Latvia, Lithuania, Luxembourg, Malta, the Netherlands, Austria, Portugal, Slovenia, Slovakia and Finland, plus the European Central Bank and the European Stability Mechanism.
Methods and definitions
The gross investment rate of non-financial corporations is defined as gross fixed capital formation divided by gross value added. This ratio relates the investment of non-financial businesses in fixed assets (buildings, machinery etc.) to the value added created during the production process.
The profit share of non-financial corporations is defined as gross operating surplus divided by gross value added. This profitability-type indicator shows the share of the value added created during the production process remunerating capital. It is the complement of the share of wage costs (plus other taxes less other subsidies on production) in value added.
The compilation of the European sector accounts follows the European System of Accounts 2010 (ESA2010) and covers the period from the first quarter of 1999 onwards.
Institutional sectors bring together economic units with broadly similar characteristics and behaviour, namely: households (including non-profit institutions serving households), non-financial corporations, financial corporations, government and the rest of the world. In the latter, to measure the external transactions of the euro area / European Union, it is necessary to remove cross-border flows within the area concerned.
Eurostat’s website includes detailed annual and quarterly sector accounts of Member States of the European Economic Area and derived key indicators published around 120 days after each quarter (which also cover annual indicators such as debt-to income ratios). A subset of quarterly key indicators is published around 94 days after each quarter.
Revisions and timetable
Compared with data released on 26 October 2018, the investment rate of non-financial corporations for the second quarter of 2018 has been revised from 22.9% to 23.0%.The profit share of non-financial corporations for the second quarter of 2018 has been revised from 40.8% to 40.6%.
The complete set of sectoral data will be updated in the dedicated section of the Eurostat website on 29 January 2019.
Source: Eurostat