


Elliott wave analysis: USDCAD In A Triangle consolidation

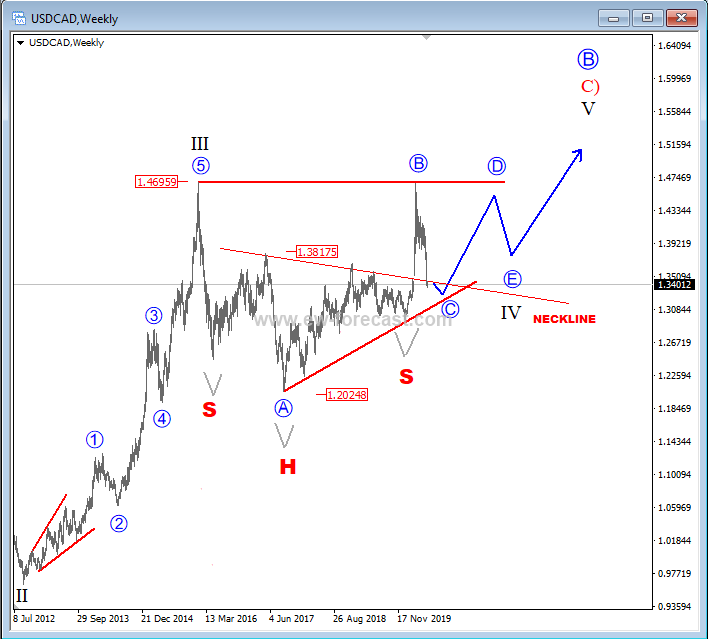
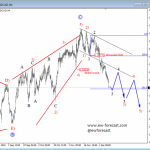
USDCAD is bullish long-term, however recent price activity suggest price being trapped in a triangle correction of a higher degree wave IV. Now we see price reversing lower, down from the upper triangle line, suggesting that wave C of a triangle is underway. That said, further sideways price activity can be seen, as we still miss waves C, D and E. Once they develop, a new recovery above current 1.47 high can be seen into a wave V.
USDCAD, weekly
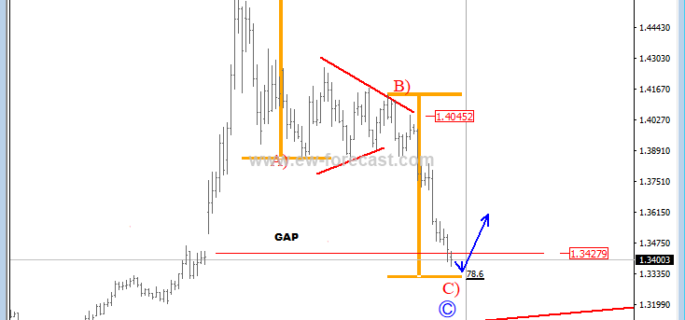
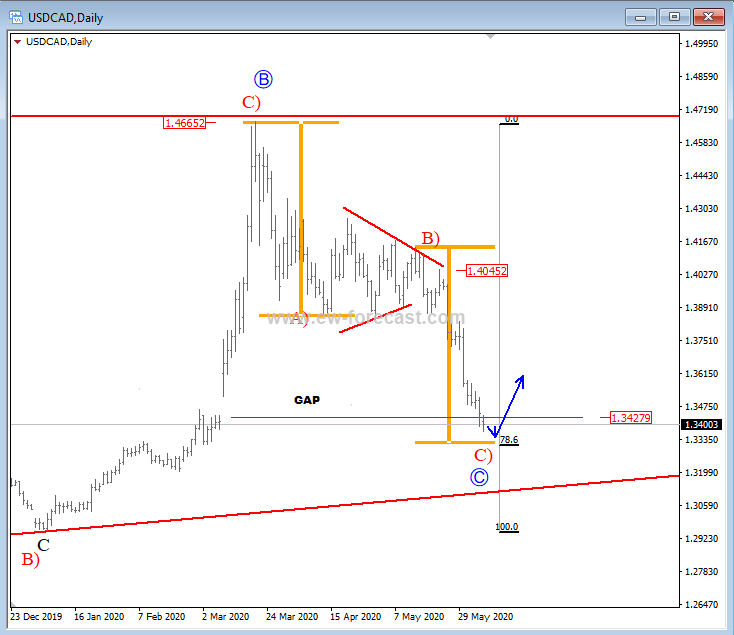
On the daily chart of USDCAD we see price in a wave C) of C, which is now right at possible support, at 1.347 level, level of a former gap, and at Fib. Ratio of 78.6. A bounce in five lesser degree waves would suggest a completed blue wave C, and further upside underway into a wave D.
USDCAD, daily
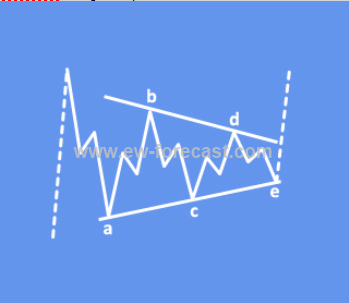
A Triangle is a common 5-wave pattern labelled A-B-C-D-E that moves counter-trend and is corrective in nature. Triangles move within two channel lines drawn from waves A to E, and from waves B to D. A Triangle is either contracting or expanding depending on whether the channel lines are converging or expanding. Triangles are overlapping five wave affairs that subdivide 3-3-3-3-3.
Triangles can occur in wave 4, wave B, wave X position or in some very rare cases also in wave Y of a combination.
An example of a triangle pattern:
Disclosure: Please be informed that information we provide is NOT trading recommendation or investment advice. All of our work is for educational purposes only.
http://www.ew-forecast.com/service
Find more: Contributing Author
Related Posts
 Elliott Wave Analysis: Higher Degree Correction on USDCAD Looks Completed; Weakness Could Already Be Here
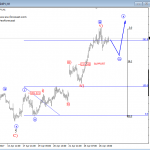 Elliott Wave Analysis: USDCAD and USDJPY
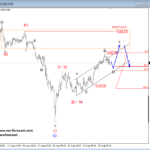 USDCAD Slowing Down, while Gold Ticking Higher – Elliott wave Analysis
 Elliott wave Analysis: USDCAD and AUDUSD Update
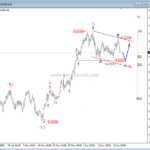 USDCAD and NZDUSD Elliott wave analysis


