


Crude Oil Suggests A Reversal Down – Elliott wave analysis

Crude oil is trading in a wedge pattern from end of June, which is known as an Elliott wave ending diagonal. We are tracking final stages of a sub-wave v of 5 being made, so be aware of limited upside, and a bearish reversal in sessions/days ahead.
Possible resistance/reversal area can be around $44.00.
Crude oil, 1h

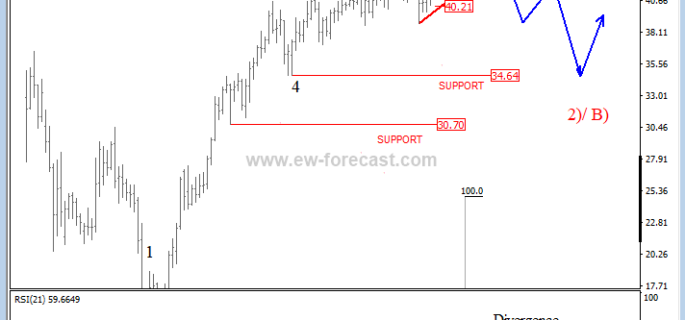
On the daily chart of Crude oil we see energy in a strong recovery, up from 7.08 lows, which can be part of a bigger, bullish reversal. We see a higher degree wave A)/1) which can be in final stages with its structure, and can look for resistance, and a reversal into a wave B)/2) correction at the $44.0 level.
The relative strength index below the chart also suggests resistance and a reversal in days ahead.
Crude oil, Daily

An ending diagonal is a special type of pattern that occurs at times when the preceding move has gone too far too fast, as Elliott put it. A very small percentage of ending diagonals appear in the C wave position of A-B-C formations. In double or triple threes, they appear only as the final C wave. In all cases, they are found at the termination points of larger patterns, indicating exhaustion of the larger movement.
Ending diagonal in an uptrend:
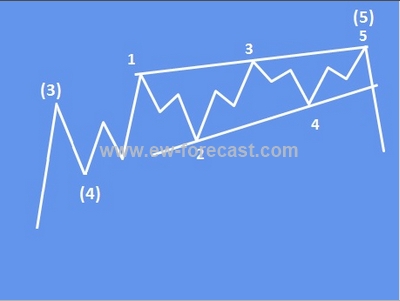
- structure is 3-3-3-3-3
- a wedge shape within two converging lines
- wave 4 must trade into a territory of a wave 1
- appears primarily in the fifth wave position, in the C wave position of A-B-C and in double or triple threes as the final “C” wave
Disclosure: Please be informed that information we provide is NOT trading recommendation or investment advice. All of our work is for educational purposes only.
http://www.ew-forecast.com/service
Find more: Contributing Author
Related Posts
 Elliott Wave Analysis: USDCHF Looking for A Reversal Higher
 Elliott Wave Analysis: USDCAD Showing First Signs of A Top; A Reversal May Already Be Here
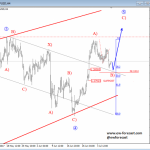 Elliott Wave Analysis: GBPUSD Trading In A Temporary Correction
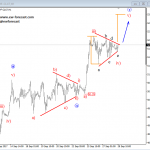 Elliott Wave Analysis: GBPUSD, USDNOK and Crude oil
 Elliott Wave Analysis: Crude OIL and GOLD


