Elliott Wave Analysis: S&P500 Still Looking Bullish

Elliott Wave Analysis: S&P500 Still Looking Bullish
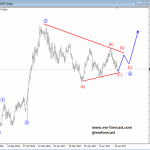
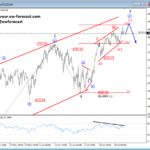
S&P500 is trading bullish since November of 2016, when wave II was completed. From there price continued strongly higher into wave III which can be in late stages with current expanding diagonal in sub-wave five which may see a top at 2500/30 area. Afterwards a three-wave correction into wave IV can follow.
S&P500, Daily

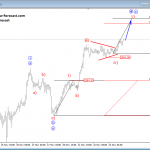
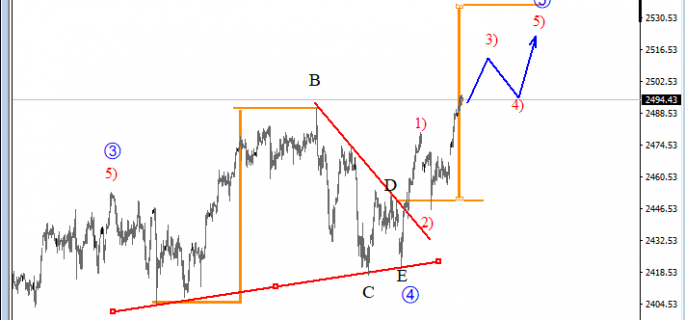
Regarding the 4h view, E-mini S&P500 is trading in a complex upward move within wave five, final leg of an expanding diagonal as shown on a daily chart. We can see that price made a new sharp reaction higher which is now a confirmation that wave c of Y is in progress. Ideally current rally will search for a top near the 2510 region this week.
S&P500, 4H

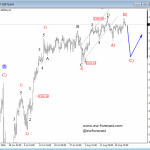
However, if price will remains in sharp bullish mode and breaks above 2500 then market may be headed up to 2540 area per our COUNT #2.
S&P500, 4H (second count)

Disclosure: Please be informed that information we provide is NOT trading recommendation or investment advice. All of our work is for educational purposes only.
http://www.ew-forecast.com/service
Find more: Contributing Authors