Elliott Wave Analysis: S&P500 Aiming For The 2300 Mark
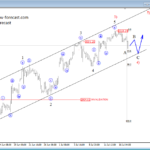
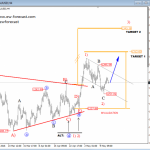
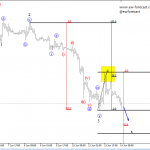
 Stocks recovered very nicely and sharply since mid of February so a new bullish reversal is here. Reason for a bullish trend was a five wave rise in black wave I so obviously we are looking much higher now into wave III of V). As always, we will focus on minimum expectations, which in our case is 2300 mark where black wave III would be equal to wave I. We are staying bullish as long as market trades above 2070 area.
S&P500, Daily

Click to Enlarge
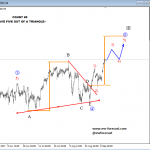
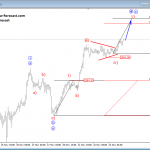
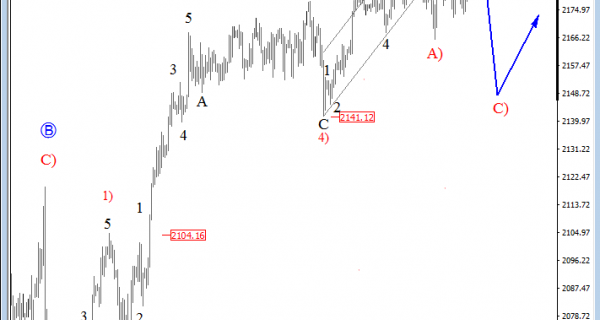
Normally when market completes a five wave move, the direction of a trend will change with minimum three waves. And this is exactly what is expected on the 4h chart of E-mini S&P500. We can see five waves up from 2141 to 2190 that represents a final leg within larger bullish impulse, so ideally market is now making a new corrective retracement that should be made by three waves. If we are correct, then wave C) will send price back down to 2140-2150 area.
S&P500, 4H

Click to Enlarge
http://www.ew-forecast.com/service
Find more: Contributing Authors