Technical Analysis Gold – Drops to Six Week Low Near $1280
Technical Analysis Gold for Friday, August 1, 2014
In the last few days gold has been easing lower and placing pressure on the support level at $1300 which eventually gave way resulting in gold falling sharply back down to a six week low near $1280. Over the last few weeks the $1290 level has shown some signs of support and held gold up, however now that it has been broken, it may provide some resistance in the near future. Gold did well at the end of last week to surge higher through the $1300 level back up towards $1310 before easing slightly to start this new week. The $1300 level has been reinforced as a level of significance in the last couple of weeks with gold falling sharply from its highs above $1345 back down to this level where it was initially met with overwhelming demand. During the second half of June, gold steadily moved higher but showed numerous incidents of indecision with its multiple doji candlestick patterns on the daily chart. This happened around $1320 and $1330.
Several weeks ago now gold enjoyed a stunning surge higher to break through some key levels along its way to reaching a then two month high just above $1320 and immediately after it eased away ever so slightly and consolidated with its flow of doji patterns. It was then able to slowly move higher to a four month high above $1345. It was also able to break through the $1300 level which has recently played a role again. If sellers do take advantage of these relatively higher prices which will most likely bring the $1300 level back into play. The OANDA long position ratio has surged back up above 70% showing a change in sentiment to more bullish. At the beginning of June, gold did very well to repair some damage and return to the key $1275 level, then it has continued the momentum pushing a higher to its recent four month high.
After moving so little for an extended period, gold dropped sharply back in May from above the well established support level at $1275 as it completely shattered this level falling to a four month low around $1240. It remained around support at $1240 for several days before its strong rally higher. It pushed down towards $1280 before sling shotting back and also had an excursion above $1300 for a short period before moving quickly back to the $1293 area again. Over the last few weeks gold has eased back from around $1315 to establish its recent narrow trading range below $1295 before its recent slump.
Over the last few months the $1275 level has established itself as a level of support and on several occasions has propped up the price of gold after reasonable falls. Throughout the second half of March gold fell heavily from resistance around $1400 back down to a several week low near support at $1275. Both these levels remain relevant as $1275 continues to offer support and the $1400 level is likely to play a role again should gold move up higher. Through the first couple of months of this year, gold moved very well from a longer term support level around $1200 up towards a six month higher near $1400 before returning to its present trading levels closer to $1300.
Gold was stuck near a six-week low on Friday and headed for a third straight weekly loss, as U.S. economic optimism offset any safe-haven demand from geopolitical tensions and lower equities. Spot gold was little changed at $1,282.79 an ounce by 0017 GMT, after falling 1 percent in the previous session. It hit $1,280.76 on Thursday – its lowest since June 19. Gold was on track for a 2 percent fall for the week, after posting its sharpest monthly drop of the year in July. The metal was hurt by data on Thursday that showed that U.S. labor costs recorded their biggest gain in more than 5-1/2 years in the second quarter, bolstering the economy’s outlook. A strong economy blunts gold’s appeal as an alternative to riskier assets such as equities. Investors were now awaiting U.S. non-farm payrolls data to for further clues about the economy, even as they were keeping an eye on geopolitical tensions in the Middle East and Ukraine.
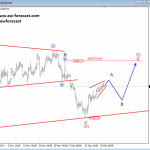
(Daily chart / 4 hourly chart below)


Gold August 1 at 04:15 GMT 1284.1 H: 1285.1 L: 1281.4
Gold Technical
![]()
During the early hours of the Asian trading session on Friday, Gold is trading in a very small range between $1282 and $1284 after dropping sharply over the last couple of days. Current range: trading right around $1284.
Further levels in both directions:
• Below: 1275 and 1240.
• Above: 1330.
Economic Releases
- 01:30 AU PPI (Q2)
- 05:00 JP Vehicle Sales (Jul)
- 08:00 EU Manufacturing PMI (Jul)
- 08:30 UK CIPS/Markit Manufacturing PMI (Jul)
- 12:30 US Core PCE Price Index (Jun)
- 12:30 US Non-farm Payrolls (Jul)
- 12:30 US Personal income & spending (Jun)
- 12:30 US Private Payrolls (Jul)
- 12:30 US Unemployment (Jul)
- 13:45 US Manufacturing PMI (Jul)
- 13:55 US Univ of Mich Sent. (Final) (Jul)
- 14:00 US Construction Spending (Jun)
- 14:00 US ISM Manufacturing (Jul)
*All release times are GMT
This article is for general information purposes only. It is not investment advice or a solution to buy or sell securities.
Source: marketpulse