Technical Analysis Gold – Indecision Resurfaces Under $1320
Technical Analysis Gold for Tuesday, July 8, 2014
After pushing higher to a three month high above $1330 last week, gold has now just eased a little lower back to below $1320 and is showing more signs of indecision again after doing it a lot over the last few weeks. After several days of classic signs of indecision with its multiple doji candlestick patterns on the daily chart a couple of weeks ago, gold pushed higher before experiencing further indecision just under $1330 before easing lower. A few weeks ago gold enjoyed a stunning surge higher to break through some key levels along its way to reaching a then two month high just above $1320 and immediately after it eased away ever so slightly and consolidated with its flow of doji patterns. It was also able to break through the $1300 level and this level is likely to play a role again should gold ease lower, which is likely. If sellers do take advantage of these relatively higher prices which will most likely bring the $1300 level back into play. The OANDA long position ratio has dropped to its lowest level in a few months around 51% showing a much more bearish sentiment than the long term average.
A few weeks ago gold did very well to repair some damage and return to the key $1275 level, then it has continued the momentum pushing a higher to its recent two month high. After moving so little for an extended period, gold dropped sharply several weeks ago from above the well established support level at $1275 as it completely shattered this level falling to a four month low around $1240. It remained around support at $1240 for several days before its recent rally higher. Prior to the strong fall a few weeks ago gold had remain fixated on the $1293 level and had done very little as volatility has dried up completely resulting in gold moving very little. It pushed down towards $1280 before sling shotting back and also had an excursion above $1300 for a short period before moving quickly back to the $1293 area again. Over the last few weeks gold has eased back from around $1315 to establish its recent narrow trading range below $1295 before its recent slump.
Over the last few months the $1275 level has established itself as a level of support and on several occasions has propped up the price of gold after reasonable falls. Throughout the second half of March gold fell heavily from resistance around $1400 back down to a several week low near support at $1275. Both these levels remain relevant as $1275 continues to offer support and the $1400 level is likely to play a role again should gold move up higher. Through the first couple of months of this year, gold moved very well from a longer term support level around $1200 up towards a six month higher near $1400 before returning to its present trading levels closer to $1300.
Gold fell on Monday as the dollar firmed on speculation over an earlier-than-expected hike in U.S. interest rates following strong job data, which dented investment demand for the metal. Gold has been under pressure since data on Thursday showed U.S. employment growth jumped in June and that the jobless rate closed in on a six-year low, evidence of brisk economic growth. The data led investors to bring forward their views on timing of the first rate hike by the U.S. Federal Reserve to the middle of 2015, although most economists said that more data was needed. An interest rate hike would encourage investors to withdraw money from non-interest-bearing assets such as gold. Spot gold slipped 0.4 percent to $1,315 an ounce, while U.S. gold futures for August delivery settled down $3.60 percent at $1,317 an ounce.
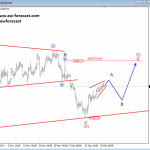
(Daily chart / 4 hourly chart below)


Gold July 8 at 01:00 GMT 1318.1 H: 1320.8 L: 1317.9
Gold Technical
![]()
During the early hours of the Asian trading session on Tuesday, Gold is easing lower under $1320 after spending the last few days falling back from the highs above $1330. This limited activity has occurred after it ran into resistance around $1330 in recent times. Current range: trading right around $1318.
Further levels in both directions:
• Below: 1240.
• Above: 1330.
Economic Releases
- 23:50 (Mon) JP Bank Lending Data (Jun)
- 23:50 (Mon) JP Current Account (May)
- 01:30 AU NAB Business Conditions (Jun)
- 01:30 AU NAB Business Confi dence (Jun)
- 08:30 UK Industrial Production (May)
- 08:30 UK Manufacturing Production (May)
- 14:00 UK NIESR GDP Est. (Jun)
- 19:00 US Consumer Credit (May)
- JP Economy Watchers Survey (Jun)
*All release times are GMT
Source: marketpulse