


Thursday November 6: OSB Daily Technical Analysis – Commodities
OSB Daily Technical Analysis for November 6, 2014
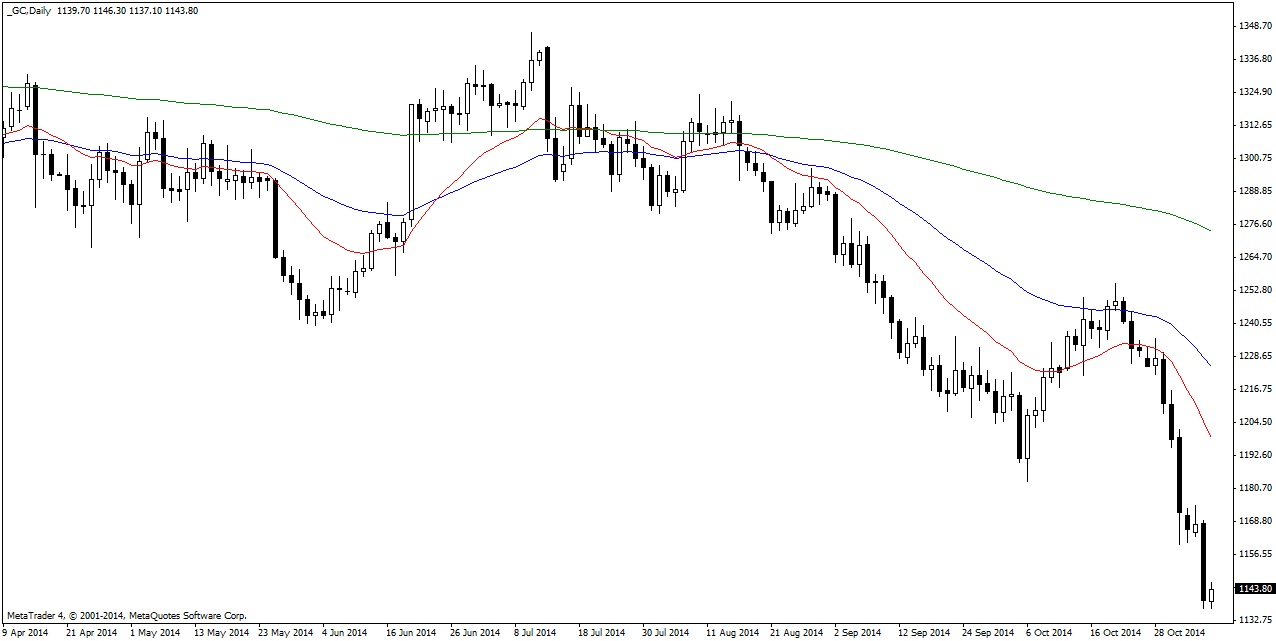
Gold sold off and continued its downward trajectory. The break and close below the $1150 mark suggests that gold is head lower in the mid-term with $1100 being a very realistic target. Any bounces are likely to be short lived and sold into. Buyers are thin on the ground. Bearish.
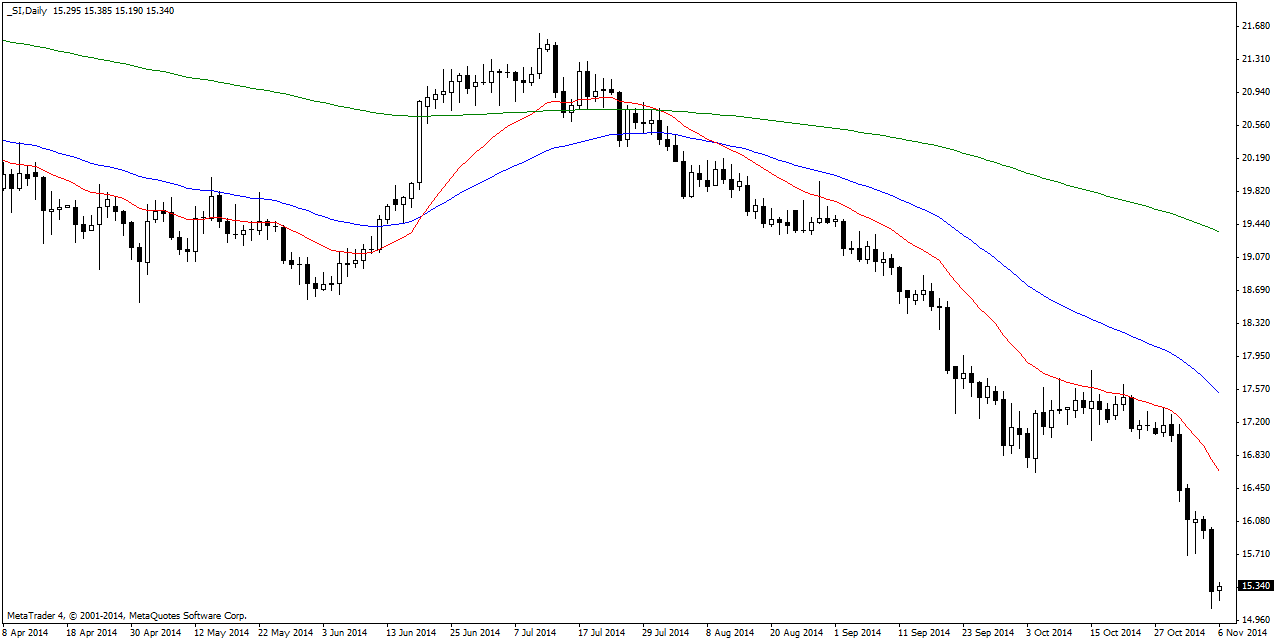
Silver fell hard testing the $15.00 for support on Wednesday which appears to be holding for now. Silver is in a one way sell only market. A close below $15.00 is likely to see the metal heading towards the $12.00 area in the mid-term.
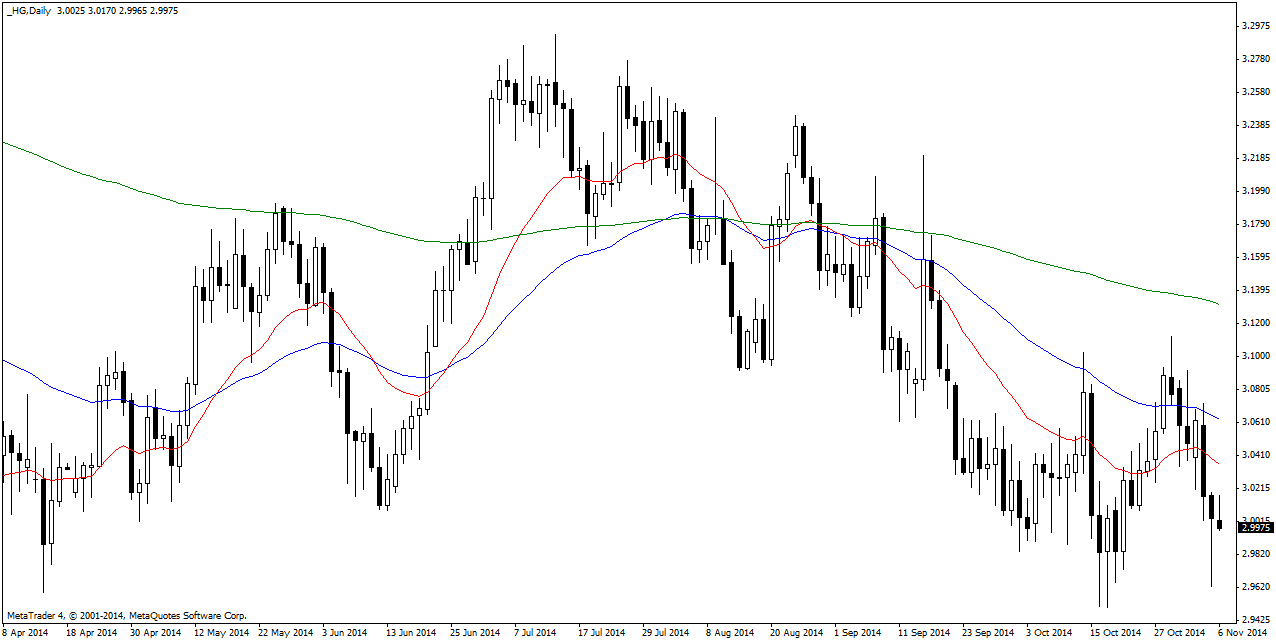
Copper (Comex) continues to flirt with the $300 support level dipping below intraday but managing to garner enough buyers to push the metal back above this key level. Support below is at $296-93. Bearish.
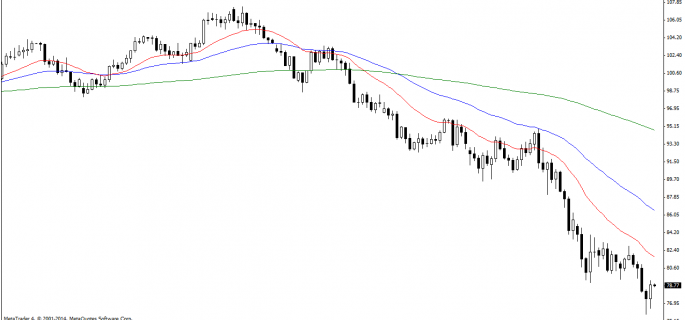
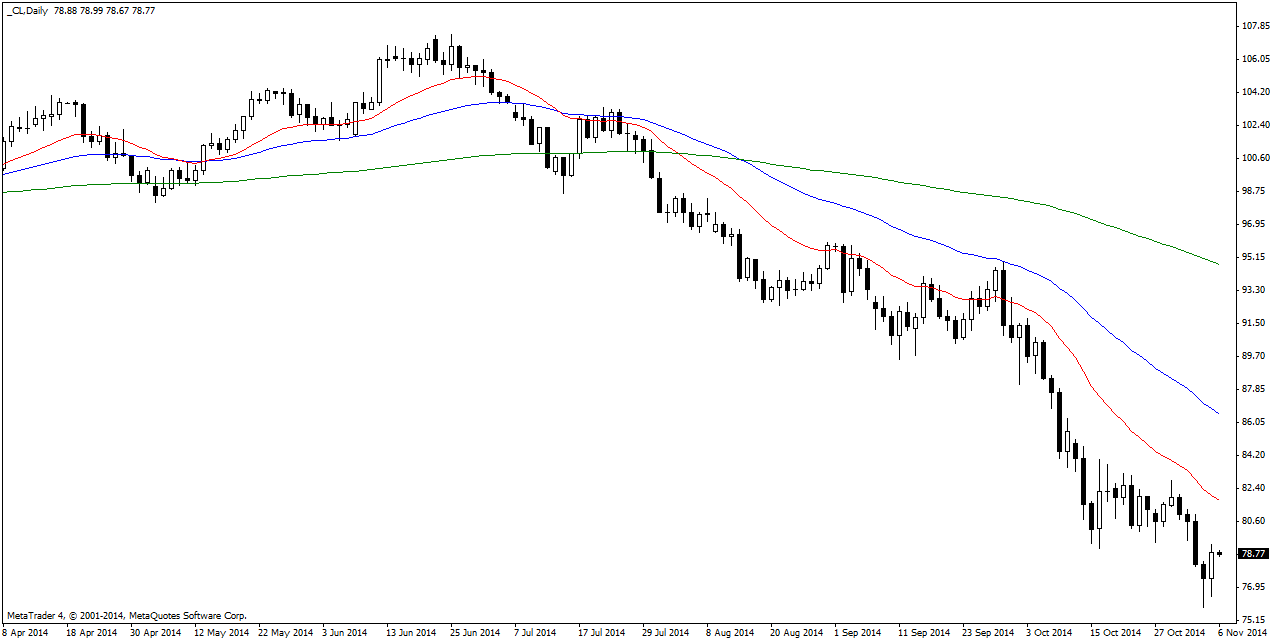
Crude oil rallied on Wednesday climbing towards $80 mark which proved too resistive to get above. Crude is likely to retest this area. A close above is likely to lead to resistance at the $82.50 level. Bearish bias remains intact.
Risk Disclaimer
Forex and CFDs are leverage products, involved a high level of risk and can result in the loss of all your invested capital. Forex and CFDs may not be suitable for all investors. You should not risk more than you are prepared to lose. Before deciding to trade, you should ensure that you understand the risks involved and take into account your level of experience.
All information on this website, including any opinion, charts, prices, news, data, Buy/Sell signals, research and analysis is our point of view and is provided as general market commentary and does not constitute any investment advice.
OneStopBrokers.com will not accept any responsibility or liability for losses incurred by customers, visitors or traders as a result of using the data available on OneStopBrokers.com. Read more
Related Posts
 Thursday November 13: OSB Daily Technical Analysis – Commodities
  Monday November 24: OSB Daily Technical Analysis – Commodities
  Monday November 10: OSB Daily Technical Analysis – Commodities
 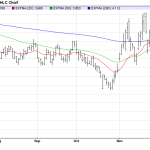 Tuesday December 23: OSB Daily Technical Analysis – Commodities
 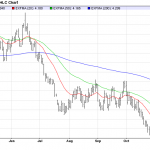 Wednesday December 3: OSB Daily Technical Analysis – Commodities


