


Interactive Brokers Group Reports Brokerage Metrics for August 2015
Interactive Brokers Group, Inc. (NASDAQ GS: IBKR) an automated global electronic broker and market maker, today reported its Electronic Brokerage monthly performance metrics for August.
Highlights for the month included:
- 737 thousand Daily Average Revenue Trades (DARTs), 49% higher than prior year and 13% higher than prior month.
- Ending client equity of $62.9 billion, 13% higher than prior year and 4% lower than prior month.
- Ending client margin loan balances of $16.3 billion, 2% lower than prior year and 10% lower than prior month.
- Ending client credit balances of $35.6 billion, 21% higher than prior year and 3% higher than prior month.
- 317 thousand client accounts, 18% higher than prior year and 1% higher than prior month.
- 529 annualized average cleared DARTs per client account.
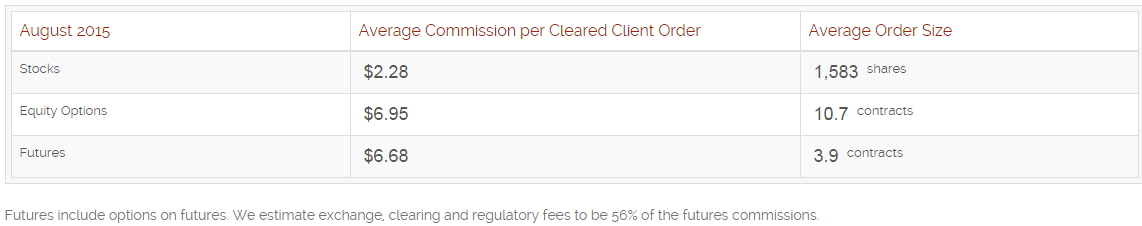
- Average commission per cleared client order of $4.15 including exchange, clearing and regulatory fees. Key products:
In the interest of transparency, we quantify our clients’ all-in cost of trade execution below.
- In August, clients’ total cost of executing and clearing U.S. Reg.-NMS stocks through IB was 1.8 basis points of trade money1, as measured against a daily VWAP2 benchmark (one basis point for the rolling twelve months).
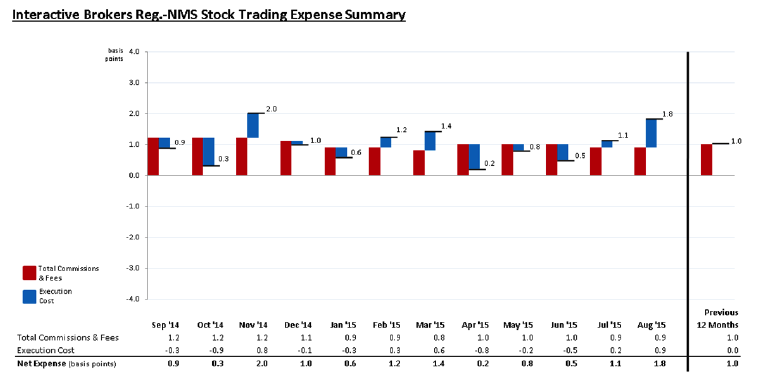

The above illustrates that the rolling twelve months’ average all-in cost of a client U.S. Reg.-NMS stock trade was one basis point.
Note 1: Trade money is the total amount of money clients spent or received, including all commissions and fees.
Note 2: Consistent with the clients’ trading activity, the computed VWAP benchmark includes extended trading hours.
Source: Interactive Brokers Group
Related Posts
 Interactive Brokers Group Reports Brokerage Metrics for March 2016
- Interactive Brokers Group Reports Brokerage Metrics for September 2015
 Algorithmic Trading: The Play-at-Home Version
- Interactive Brokers Group Reports Brokerage Metrics for January 2016
- Interactive Brokers Group Reports Brokerage Metrics for April 2015


