Elliott Wave Analysis On S&P500 And GOLD
 S&P500
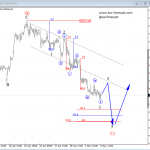
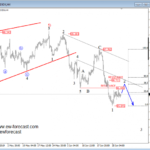
E-mini S&P500 has turned nicely lower a few weeks back from 2104 high that we labeled it as a complex W)-X)-Y) correction, so market was just in a temporary pullback that seems over now after recent bounce to the upper trendline of a corrective channel. A trendline is expected to be broken after this current pullback that can be wave 2 of a new bullish impulse, while market trades above 2029.
S&P500, 4H

Click to Enlarge
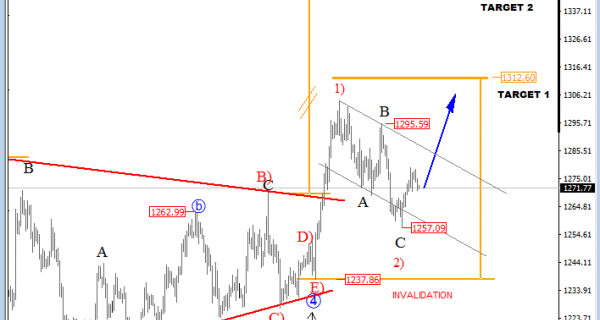
GOLD
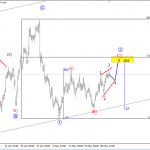
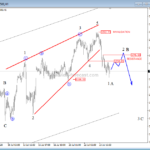
Gold made a quite deep retracement but for now only with three waves, labeled as A-B-C on 4h chart, so decline can be corrective while market trades above 1237 level. In fact, notice there was a nice bounce from 1257 in the last few sessions which could be low of wave C so more upside can follow soon. Break out of a downward channel will be just another confirmation for more gains ahead.
GOLD, 4H

Click to Enlarge
http://www.ew-forecast.com/service
Find more: Contributing Authors