Elliott Wave Analysis: S&P500 Targeting 3000, while USD Index Breaking Down!

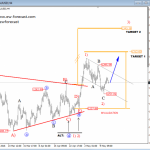
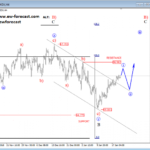
SP500 is turning higher as expected, now breaking decisively above the upper channel line which is an indication of a completed three waves of a decline. We see a sharp and impulsive run higher which means more gains are likely coming after a pullback, ideally even towards 3000 area and above. Now we see price dropping from the 2963 level, where wave 1) as part of a bigger, bullish cycle found resistance. Current drop can be part of a three-wave A-B-C correction within wave 2), which can look for support near the 2875/2850 region.
S&P500, 4h

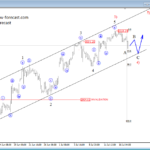
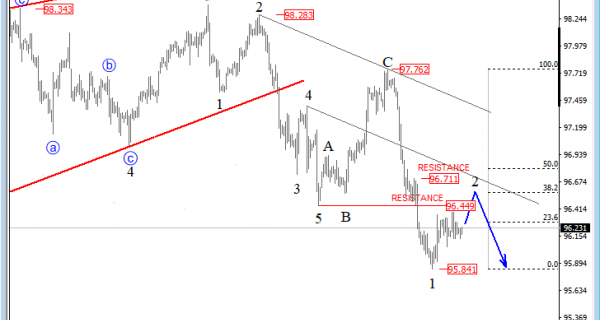
USD Index is dropping nicely, down from 97.76 level where a bigger corrective A-B-C structure had found resistance. Current drop is now part of a bigger, five-wave cycle that can take price towards, and below the 95.0 region. That said, be aware of temporary setbacks which may show up during current downtrend; wave 2 with possible resistance near 96.45/96.711 region.
USD Index, 4h

Disclosure: Please be informed that information we provide is NOT trading recommendation or investment advice. All of our work is for educational purposes only.
http://www.ew-forecast.com/service
Find more: Contributing Authors