


Elliott Wave Analysis: S&P500 In A Temporary Correction, Possible Reversal Seen Around 2012
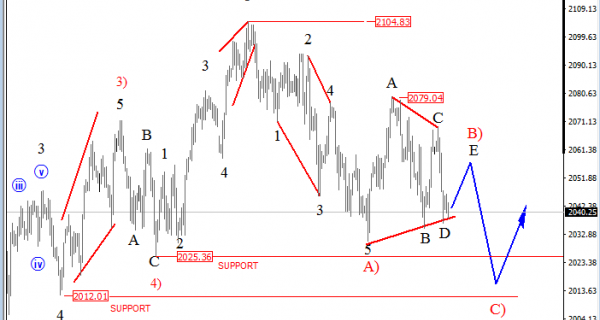
 E-mini S&P500 is trading sideways for the last few days which means that price is probably trapped in a correction. At the moment, we are looking at red wave B) that can be a triangle rather than a zigzag, because of contracting shape. However, it’s still a bearish pattern that can cause a drop down to around 2012 support with wave C), where market can be looking for a bottom this month.
S&P500, 4H

Click to Enlarge
A Triangle is a common 5 wave pattern labeled A-B-C-D-E that moves counter-trend and is corrective in nature. Triangles move within two channel lines drawn from waves A to C, and from waves B to D. Triangles are overlapping five wave affairs that subdivide into 3-3-3-3-3.
A Triangle pattern:

http://www.ew-forecast.com/service
Find more: Contributing Authors
Related Posts
 Elliott Wave Analysis: GBPUSD Undergoing A Complex Correction
 Elliott Wave Analysis On GOLD And NZDUSD
 Elliott Wave Analysis: S&P500 and USDJPY Intraday Look
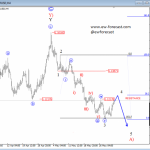 Elliott Wave Analysis: EURUSD Still In A Triangle; More Downside Still To Follow In Sub-wave D
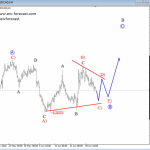 Elliott Wave Analysis: USDCAD Trading Within A Temporary Bullish Correction


