


Elliott Wave Analysis: USD Index Trading Wihtin An Uptrend
 On USD index daily chart we are observing a big sideways pattern since start of 2015; it’s slow, sideways and overlapping price action which is a personality of a contra-trend movement that can be completed now. We see it as a flat correction in black wave IV; a three wave structure where final wave C should be made by five waves. Well, we have seen a nice decline from November of 2015 counted in five legs, but as an ending diagonal. That’s a reversal pattern that already caused a strong bounce in May, so ideally recent sharp leg down was just a pullback labeled as wave two within ongoing uptrend and recent sharp turn to the upside is undergoing wave 3, which could ideally reach 99 region.
USD Index, Daily

Click to Enlarge
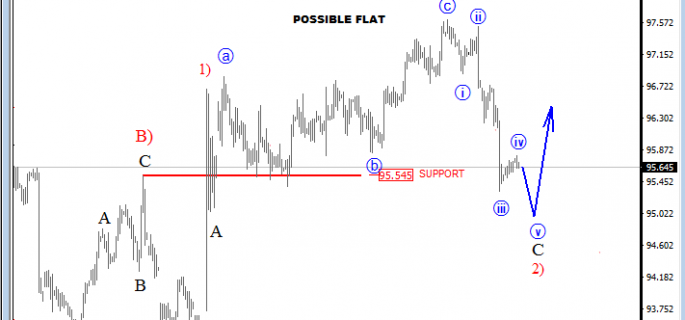
On the 4h chart of USD Index, we see that price is still trading lower around the 95.60 price area giving us the idea that red wave 2) may still not be completed and that a possible reversal may still be around the corner, near the 95.55 wave B) support area. As such sub-wave C could now be in final stages, with price now trading in minor blue wave iv.
USD Index, 4h

Click to Enlarge
http://www.ew-forecast.com/service
Find more: Contributing Authors
Related Posts
 Elliott Wave Analysis: USD Index Aiming For 98 Zone
 Elliott Wave Analysis On EURUSD And USD Index
 Elliott Wave Analysis: USD Index Impulsively Continuing Higher
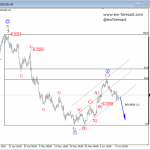 Elliott Wave Analysis: Minor Corrective Wave 2 Within Downtrend On AUDUSD
 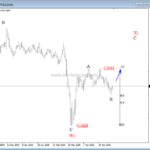 Bearish Triangle On USD Index Can Support GBPUSD – Elliott wave analysis


