


Elliott Wave Analysis on Corrective Bounce Within Downtrend On USDCAD
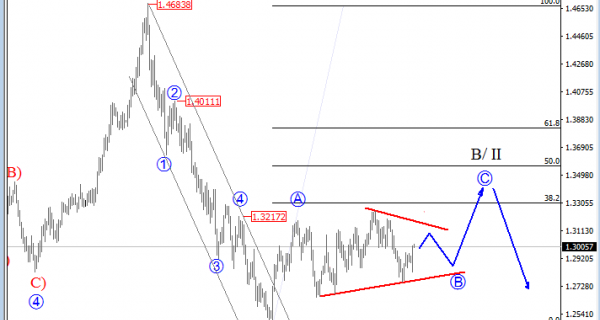
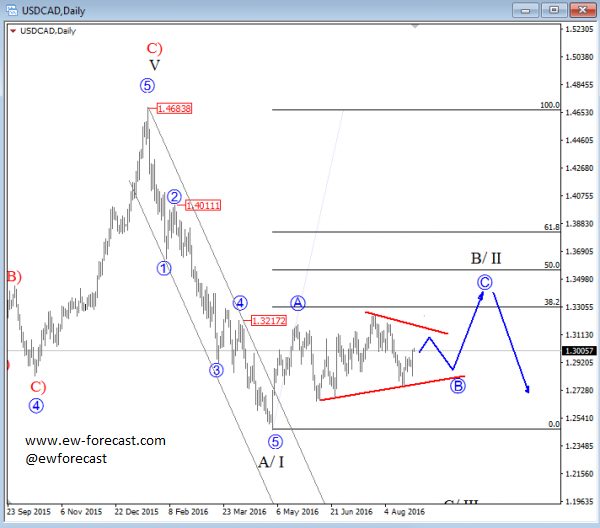
USDCAD has made a five wave of a decline from 1.4683 level which is a very strong evidence for a bearish trend. We are talking about black wave A/I, the first wave of this big bearish decline, followed by slow and overlapping price movement, that could be black wave B or II, now probably trading midway through its completion, specifically in blue wave B which seems to be a minor triangle correction. If that is the case, then this consolidation pattern may take more time to develop in wave B, before we may see a bounce into blue wave C, the final wave of this three wave correction in black wave B or II.
USDCAD, Daily
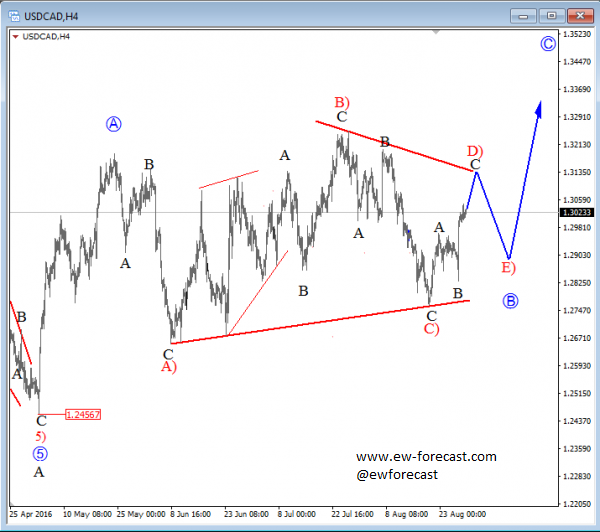
On the lower time frames, we see that USDCAD bounced from the lower side of a range last week; from 1.2760 area to be exact which indicates on still unfolding wave B correction. An updated structure shows a triangle now with sub-wave D) underway and wave E) pullback yet to come, before we may finally see a strong push up into impulsive wave C, towards 1.3400/1.3500 area where market could turn down based on daily chart.
USDCAD, 4H
http://www.ew-forecast.com/service
Find more: Contributing Authors
Related Posts
 Elliott Wave Analysis: Higher Degree Correction on USDCAD Looks Completed; Weakness Could Already Be Here
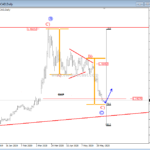 Elliott wave analysis: USDCAD In A Triangle consolidation
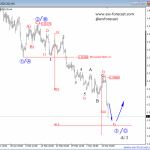 Elliott Wave Analysis On AUDUSD And USDCAD
 Elliott Wave Analysis: USDCAD Showing First Signs of A Top; A Reversal May Already Be Here
 Elliott wave analysis: USDCAD In a Bullish trend


