Elliott Wave Analysis: USD Index Trading Within A New Uptrend
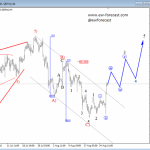
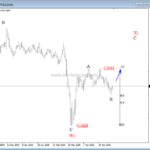
 On USD index daily chart we can see a big sideways pattern since start of 2015; slow and overlapping price action with a personality of a contra-trend movement that looks completed. We see it as a flat correction in black wave IV; a three wave structure where final wave C should be made by five waves. Well, we have seen a nice decline from November of 2015 counted in five legs, but as an ending diagonal. That’s a reversal pattern that already caused a strong bounce in May, so ideally recent turn down is just a temporary pullback within a new ongoing uptrend.
That said we are now looking at a bullish scenario, with more upside to follow especially after minor blue wave 2-circled found a support around the 61.8 Fibonacci ratio and made a move higher.
USD Index, Daily

Click to Enlarge
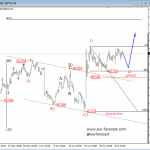
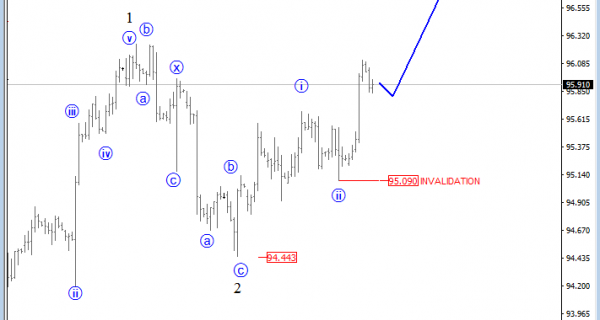
On the lower time frame, we can see that USD Index broke higher on Friday and finished the week at the highs, near 96.00 so we are wondering if maybe bullish continuation is already hapening since we have nice formation of higher highs and higher swing low from 94.44 level. Ideally market is headed up into wave three now to around 97.00, but close above back wave 1 high is needed to confirm break out of a range.
USD Index, 4H

Click to Enlarge
http://www.ew-forecast.com/service
Find more: Contributing Authors