Elliott Wave Analysis: GOLD Undergoing A Big Complex Corrective Pattern; A Reversal Higher Can Be In The Cards
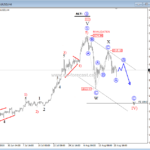
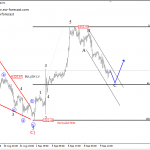
 On the daily chart of Gold we see a bullish pattern; a five waves up from November 2015 low followed by a turn down from 1375 that we believe is going to be a corrective move because of overlaps. Based on latest price data we are tracking a double zigzag now that can be headed to 1160-1180 area where buyers will try to cause a turn. Technically speaking we see this market in bullish mode as long as 1046 is not taken out.
GOLD, Daily

Click to Enlarge
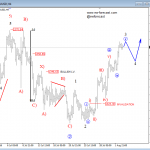
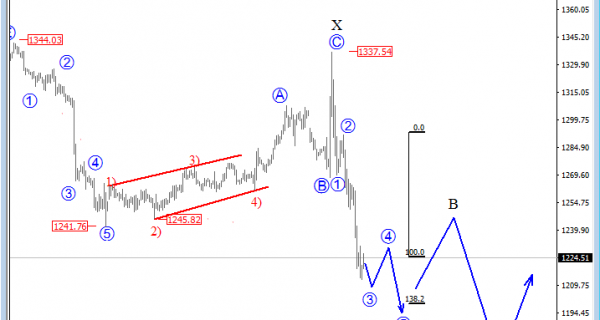
On the lower time frame, we see Gold moving sharply lower, away from 1337 swing high where market might have found a temporary top if we consider a very strong sell-off which looks like an impulse. As such, we updated the wave count, labeled it as wave X high at 1337 that belongs to a combination of two zigzags in wave B)/II) that can be underway down to 1150/70 area. In the meantime, be aware of a bounce up in wave B, but after completion of wave A near 1200 mark.
GOLD, 4H

Click to Enlarge
http://www.ew-forecast.com/service