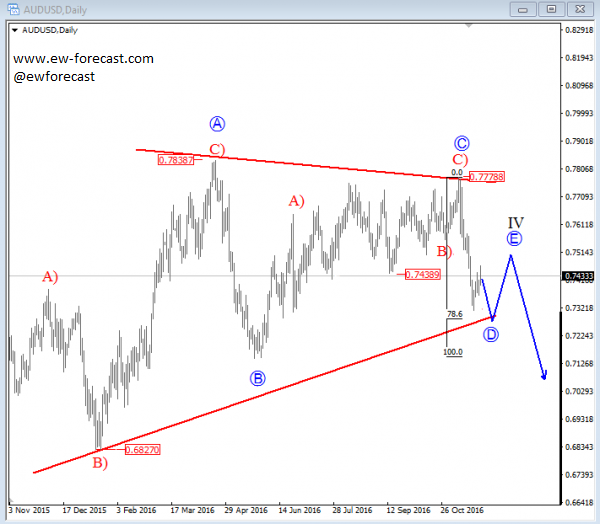
Elliott Wave Analysis: AUDUSD Trading Within A Higher Degree Correction – A Triangle

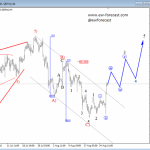
Triangle pattern is still unfolding on the daily chart, currently in wave D that can be looking for a support in weeks ahead near the lower red trendline around the 0.7250 zone, where Fibonacci of 78.6 could prove to be a nice region of support. Ideally market will make a final bounce up into wave E from that region to complete wave IV by the end of the year.
AUDUSD, Daily
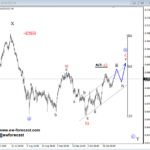
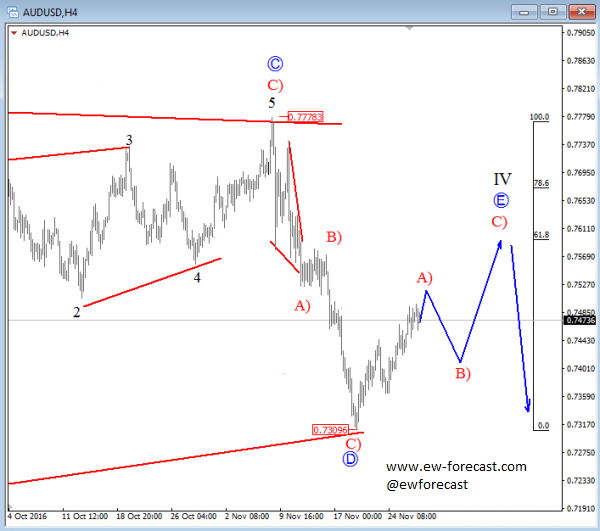
On the lower time frame, we can see that Aussie has turned down a few weeks back, from 0.7778 to be exact, from where sharp turn suggest that pair can still be trapped in a very big Elliott Wave triangle formation visible on a daily chart. If that’s true, then move down from start of November was another three wave decline, this time in wave D that shows signs of completion at 0.7310 area, so current leg up is wave E, final leg in wave IV triangle that can face resistance later this week at 0.7600-0.7700 region.
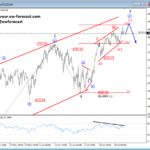
At the moment we see sub-wave A) of a three wave rise in motion, that could be near completion.
AUDUSD, 4H
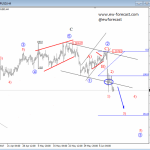
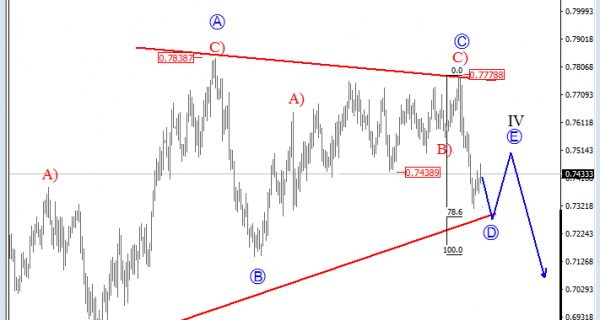
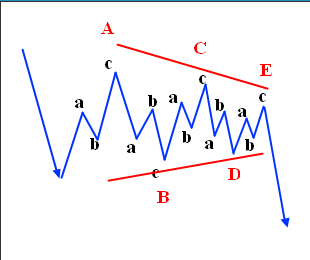
Triangles are overlapping five wave affairs that subdivide 3-3-3-3-3. They appear to reflect a balance of forces, causing a sideways movement that is usually associated with decreasing volume and volatility.
Basic Traingle Pattern:
http://www.ew-forecast.com/service
Find more: Contributing Authors