Europe Member States: How the salaries per hour changed; in Romania the highest annual increases

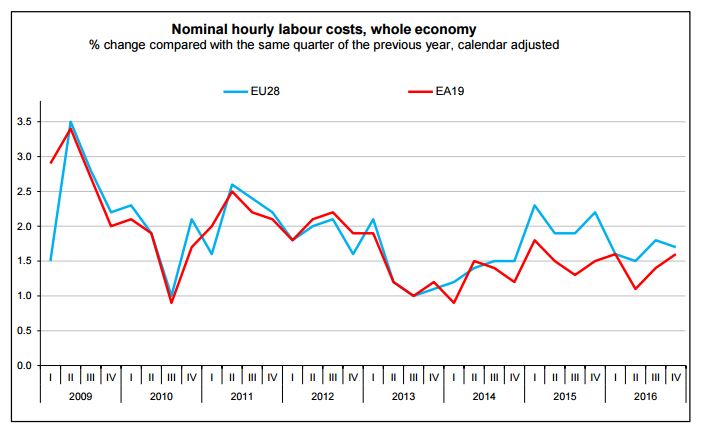
Hourly labour costs rose by 1.6% in the euro area (EA19) and by 1.7% in the EU28 in the fourth quarter of 2016, compared with the same quarter of the previous year. In the third quarter of 2016, hourly labour costs increased by 1.4% and 1.8% respectively. These figures are published by Eurostat, the statistical office of the European Union.
The two main components of labour costs are wages & salaries and non-wage costs. In the euro area, wages & salaries per hour worked grew by 1.6% and the non-wage component by 1.5%, in the fourth quarter of 2016 compared with the same quarter of the previous year. In the third quarter of 2016, the annual changes were +1.5% and +1.0% respectively. In the EU28, hourly wages & salaries rose by 1.8% and the non-wage component by 1.5% in the fourth quarter of 2016. In the third quarter of 2016, annual changes were +1.9% and +1.4% respectively.
Breakdown by economic activity
In the fourth quarter of 2016 compared with the same quarter of the previous year, hourly labour costs in the euro area rose by 1.8% in industry, by 2.3% in construction, by 1.5% in services and by 1.5% in the (mainly) nonbusiness economy. In the EU28, labour costs per hour grew by 1.7% in industry, by 3.1% in construction, by 1.6% in services and by 1.8% in the (mainly) non-business economy.
Member States
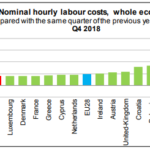
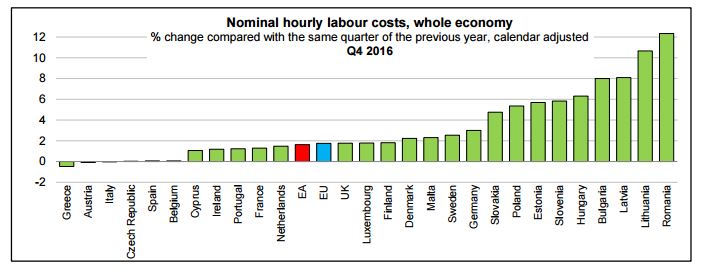
In the fourth quarter of 2016, the highest annual increases in hourly labour costs for the whole economy were registered in Romania (+12.3%), Lithuania (+10.7%), Latvia (+8.1%) and Bulgaria (+8.0%). Decreases were recorded in Greece (-0.5%) and Austria (-0.1%).
Geographical information
The euro area (EA19) includes Belgium, Germany, Estonia, Ireland, Greece, Spain, France, Italy, Cyprus, Latvia, Lithuania, Luxembourg, Malta, the Netherlands, Austria, Portugal, Slovenia, Slovakia and Finland.
The European Union (EU28) includes Belgium, Bulgaria, the Czech Republic, Denmark, Germany, Estonia, Ireland, Greece, Spain, France, Croatia, Italy, Cyprus, Latvia, Lithuania, Luxembourg, Hungary, Malta, the Netherlands, Austria, Poland, Portugal, Romania, Slovenia, Slovakia, Finland, Sweden and the United Kingdom.
Methods and definitions
The Labour Cost Index is a short-term indicator showing the development of hourly labour costs incurred by employers, in nominal terms, that is without adjusting for price developments. It is calculated dividing the labour cost in national currency by the number of hours worked. Therefore, the development of variables, labour costs and hours worked, affect the evolution of the index (base year = 2012).
The quarterly changes in hourly employers’ costs are measured for total labour costs and its main components: wages and salaries; and non-wage costs (labour costs other than wages and salaries). Total labour costs (TOT) cover wage and non-wage costs less subsidies. They do not include vocational training costs or other expenditures such as recruitment costs, spending on working clothes, etc.
Wage and salary costs (WAG) include direct remuneration, bonuses, and allowances paid by an employer in cash or in kind to an employee in return for work done, payments to employees saving schemes, payments for days not worked and remuneration in kind such as food, drink, fuel, company cars, etc.
Labour costs other than wages and salaries (OTH – non-wage costs) include the employers’ social contributions plus employment taxes regarded as labour costs less subsidies intended to refund part or all of the employer’s cost of direct remuneration. Eurostat publishes Labour Cost Index data for NACE Rev. 2 sections B to S. The aggregate is referred to as “Whole economy” for the sake of simplification, even if agriculture, activities of households as employers and activities of extraterritorial organisations are excluded.
Source: Eurostat