Elliott Wave Analysis: Unfolding Triangle on S&P500 Pointing Higher
 Elliott Wave Analysis: Unfolding Triangle on S&P500 Pointing Higher
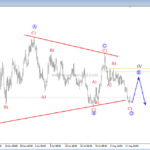
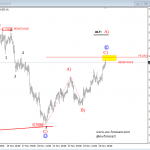
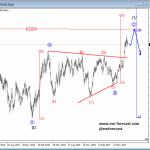
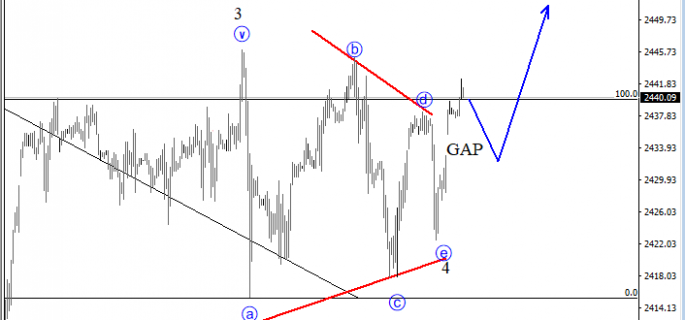
On the S&P500 we see price trading higher away from the wave 4 consolidation, where index completed a slow and sideways triangle correction. This triangle pattern occurs prior to the final wave, which means we see current rally taking price higher into final wave 5. Once wave 5 fully unfolds, a new higher degree three wave set-back can follow on the S&P500. Ideally, we will see limited upside around the Fibonacci ratio of 161.8 later this week.

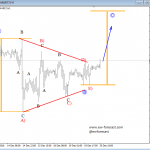
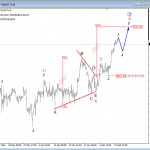
A Triangle is a common 5-wave pattern labeled A-B-C-D-E that moves counter-trend and is corrective in nature. Triangles move within two channel lines drawn from waves A to C, and from waves B to D. A Triangle is either contracting or expanding depending on whether the channel lines are converging or expanding. Triangles are overlapping five wave affairs that subdivide 3-3-3-3-3.
Triangles can occur in wave 4, wave B, wave X position or in some very rare cases also in wave Y of a combination.
Triangle pattern:

Disclosure: Please be informed that information we provide is NOT trading recommendation or investment advice. All of our work is for educational purposes only.
http://www.ew-forecast.com/service
Find more: Contributing Authors