Basic Attention Token and Stellar are forming a bullish triangle pattern

We noticed that some of cryptocurrencies can be completing a big bullish triangle pattern.
In 2017, we have seen sharp and impulsive rise in the whole Crypto market, but later in the beginning of 2018 cryptocurrencies began to fall and we noticed that some of them can be approaching the end of a correction soon.
We chose Basic Attention Token and Stellar, where we see nice and clear big bullish triangle patterns, which can be trading in the final wave E, so we should be aware of a new bullish cycle soon, because we know that the whole Crypto market is more or less in positive correlation.
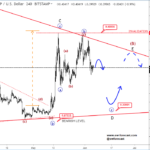
Let’s start with Bitcoin! Looking at this daily logarithmic scale chart, we can see that a similar correction from January till August was already in 2015, so we would not be surprised if the cycle this year is repeated. That said, the first evidence that correction can be approaching the end is here.
BTC LOG CHART, Daily

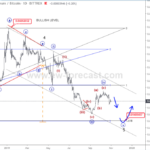
Now let’s take a look on Basic Attention Token. As said above and as you can see, it’s trading within a big bullish triangle pattern, which is a continuation pattern, so more upside is expected, once it fully unfolds. We are tracking a final wave (E), which can be looking for a support around ideal 61,8% Fibonacci retracement of wave (D) or at that red lower support line of a triangle, so be aware of a bounce between 0.000040 – 0.000035 support area. Just keep in mind that for every analysis we need a confimartion and in this case we need to see a break above 0.60 region to confirm our view.
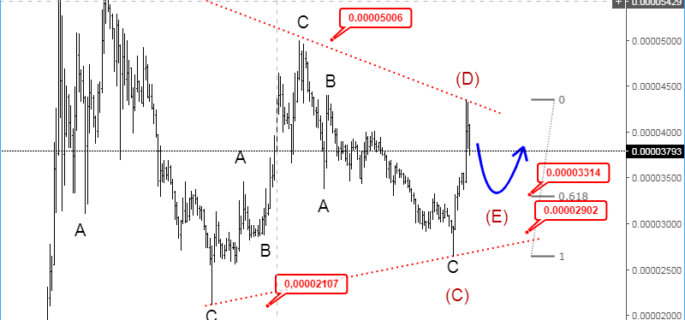
BATBTC, Daily

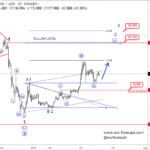
Something similar we can see on Stellar. Here as well we are tracking a big bullish triangle, which can be also trading in the final wave (E), so be aware of a bounce once wave (E) fully unfolds. Ideal support would be around 61,8% Fibonacci retracement and 0.000033 level, but it can be even deeper towards that red lower support line of a triangle, so downside can be limited around 0.000029 level. However, as long as it’s trading above 0.000021 region, our triangle remains valid, just keep in mind that bullish triangle can be confirmed only if price goes above 0.000050 level.
STRBTC, Daily

Disclosure: Please be informed that information we provide is NOT trading recommendation or investment advice. All of our work is for educational purposes only.
http://www.ew-forecast.com/service
Find more: Contributing Authors