


Elliott Wave Analysis: Ripple Doesn’t Show Any Bullish Signs, Yet!

Ripple is trading sideways for a long time despite bullish turn on many major cryptocurrencies, so we still think that the bottom is not in place yet, especially because of Ripple logarithmic scale chart, which has the same wave structure as it had BTC last year! However, we are observing a big bearish triangle in wave (B) and once it fully completes, this is when it may send the price towards 0.20 – 0.13 support area for a wave (C).

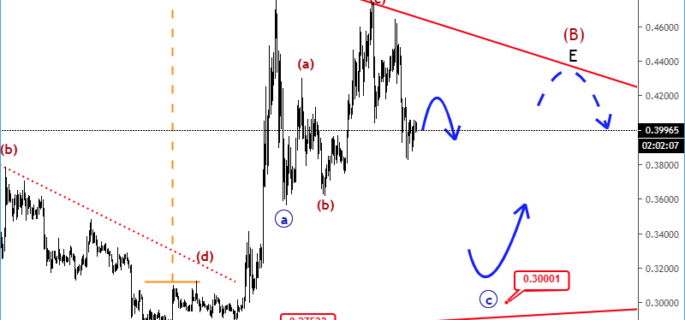
Now on the 4h chart, we can see that ripple turned down from projected 0.48 resistance area again after we noticed a three-wave corrective rise in wave C of a big bearish triangle in wave (B). So, Ripple is not bullish yet and sooner or later we may see a break into 2018 lows. However, for now we are tracking a new three-wave a-b-c decline in wave D towards 0.30 area, where bulls may wake up again for the final wave E, just keep in mind that a triangle can be bearish confirmed only below 0.2750 region!
Ripple, 4h

Disclosure: Please be informed that information we provide is NOT trading recommendation or investment advice. All of our work is for educational purposes only.
http://www.ew-forecast.com/service
Find more: Contributing Authors
Related Posts
 Basic Attention Token and Stellar are forming a bullish triangle pattern
 BCHUSD Can See One More Leg Lower, Before A Recovery – Elliott wave
 BTCUSD Can turn Lower for 10K
 ETHUSD Classic – Break of 7.35 Would Skyrocket The Crpyto Currencie (Elliott Wave)
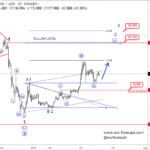 Elliott Wave Analysis: Litecoin and DASH Are Looking Bullish


