Elliott wave Analysis: EURCAD Breaking Higher, And AUDNZD Showing A Bearish Path

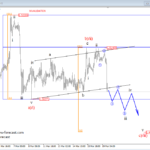
EURCAD can be showing early evidences of a completed complex correction within higher degree wave b as part of a three-wave a-b-c reversal. A suggestion that the triangle pattern in wave b is completed is a break above the upper triangle line, which can at the same time be part of wave c, that can in upcoming sessions take price towards the 1.5300 level.
A break above the 1.515 level would confirm a completed triangle and wave c to be underway.
EURCAD, 4h

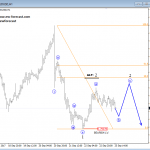
A Triangle is a common 5-wave pattern labeled A-B-C-D-E that moves counter-trend and is corrective in nature. Triangles move within two channel lines drawn from waves A to C, and from waves B to D. A Triangle is either contracting or expanding depending on whether the channel lines are converging or expanding. Triangles are overlapping five wave affairs that subdivide 3-3-3-3-3.
Triangles can occur in wave 4, wave B, wave X position or in some very rare cases also in wave Y of a combination.
An example of an EW triangle:

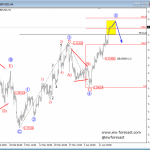
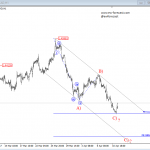
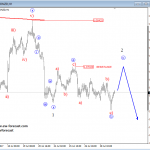
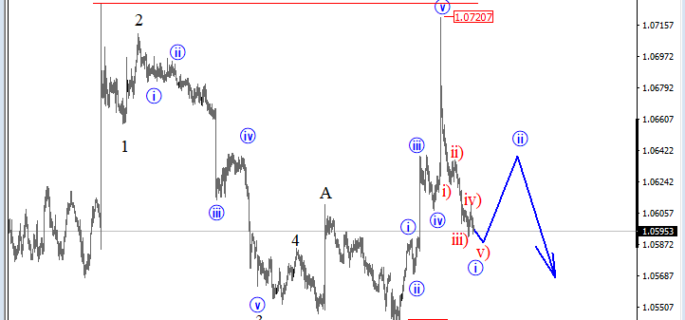
AUDNZD is moving perfectly bearish as expected, but according to a potential support on AUD cross pairs, even AUDNZD may slow down into a correction since we noticed a five-wave drop. We remain bearish as long as price keeps trading beneath 1.0720 invalidation level.
AUDNZD, 1h

Disclosure: Please be informed that information we provide is NOT trading recommendation or investment advice. All of our work is for educational purposes only.
http://www.ew-forecast.com/service
Find more: Contributing Authors