


Interesting pattern on USD/CHF points higher – Elliott wave analysis
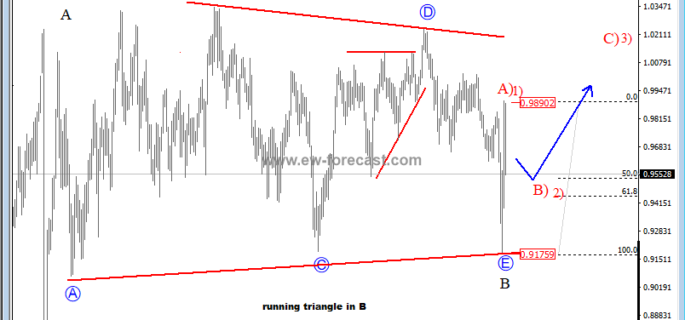

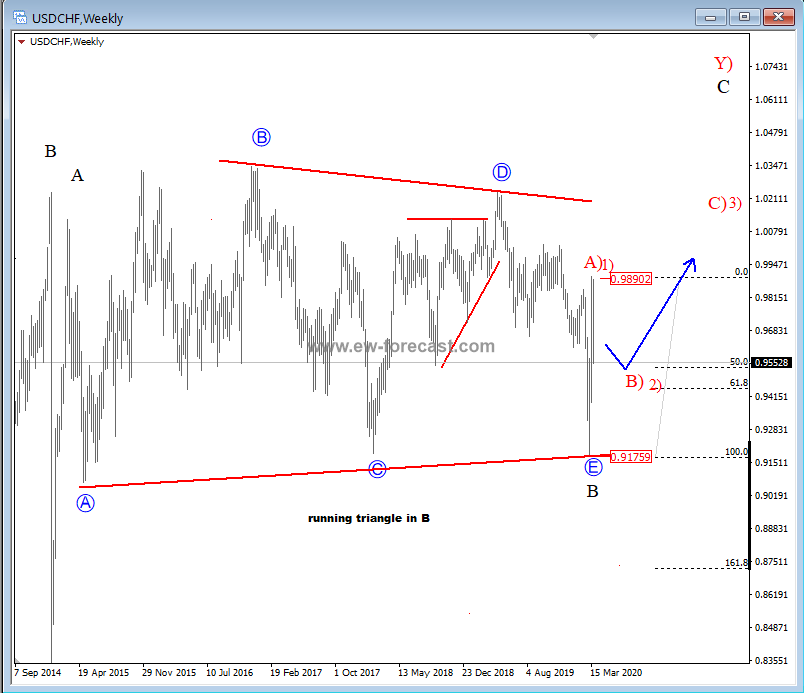
On the weekly chart of USD/CHF, we can see that price was for the last five years making a sideways, and overlapping price activity; an Elliott wave running triangle in B. This triangle can now be completed based on latest sharp recovery from the 0.9176 level, where a low was put into place. If that is the case, then be aware of a minimum three-wave recovery above the 1.023 zone for a higher degree wave C, in weeks/months to come.
That said, let us also be aware of temporary pullbacks, and first one can already be underway, down from 0.989 level. Support for it can be at the Fib. Ratio of 50.0/61.8 (0.95/0.94 region).
USDCHF, weekly
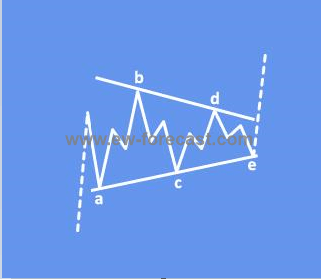
A Triangle is a common 5-wave pattern labeled A-B-C-D-E that moves counter-trend and is corrective in nature. Triangles move within two channel lines drawn from waves A to E, and from waves B to D. A Triangle is either contracting or expanding depending on whether the channel lines are converging or expanding. Triangles are overlapping five wave affairs that subdivide 3-3-3-3-3, in some cases a leg E can be a triangle itself.
Triangles can occur in wave 4, wave B, wave X position or in some very rare cases also in wave Y of a combination.
A running triangle in an uptrend:
Disclosure: Please be informed that information we provide is NOT trading recommendation or investment advice. All of our work is for educational purposes only.
http://www.ew-forecast.com/service
Find more: Contributing Author
Related Posts
 Elliott Wave Analysis: Big Triangle Correction On USDCHF Completed; More Gains May Now Follow Towards The 1.0700/1.0750
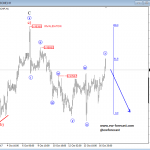 Elliott Wave Analysis: EURUSD and USDCHF Update
 USDCHF Looking Bullish – Elliott wave analysis
 Elliott Wave Analysis: German DAX and USDCHF
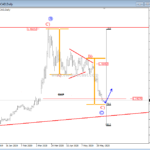 Elliott wave analysis: USDCAD In A Triangle consolidation


